Market Structure Without Time Noise
Introduction: Why Time Became a Problem
Modern market analysis is dominated by time-based representations. Candles, bars, and indicators assume that time itself is informative. Every minute, hour, or day must be displayed, even if the market does nothing meaningful during that interval.
Point-and-Figure charting emerged as a direct rejection of this assumption.
Its creators did not attempt to predict markets more accurately. They attempted to observe markets more honestly.
By removing time as a mandatory axis, Point-and-Figure charts force a simple question:
Has the market changed its state?
If the answer is no, nothing is drawn.
1. Price as the Only Necessary Variable
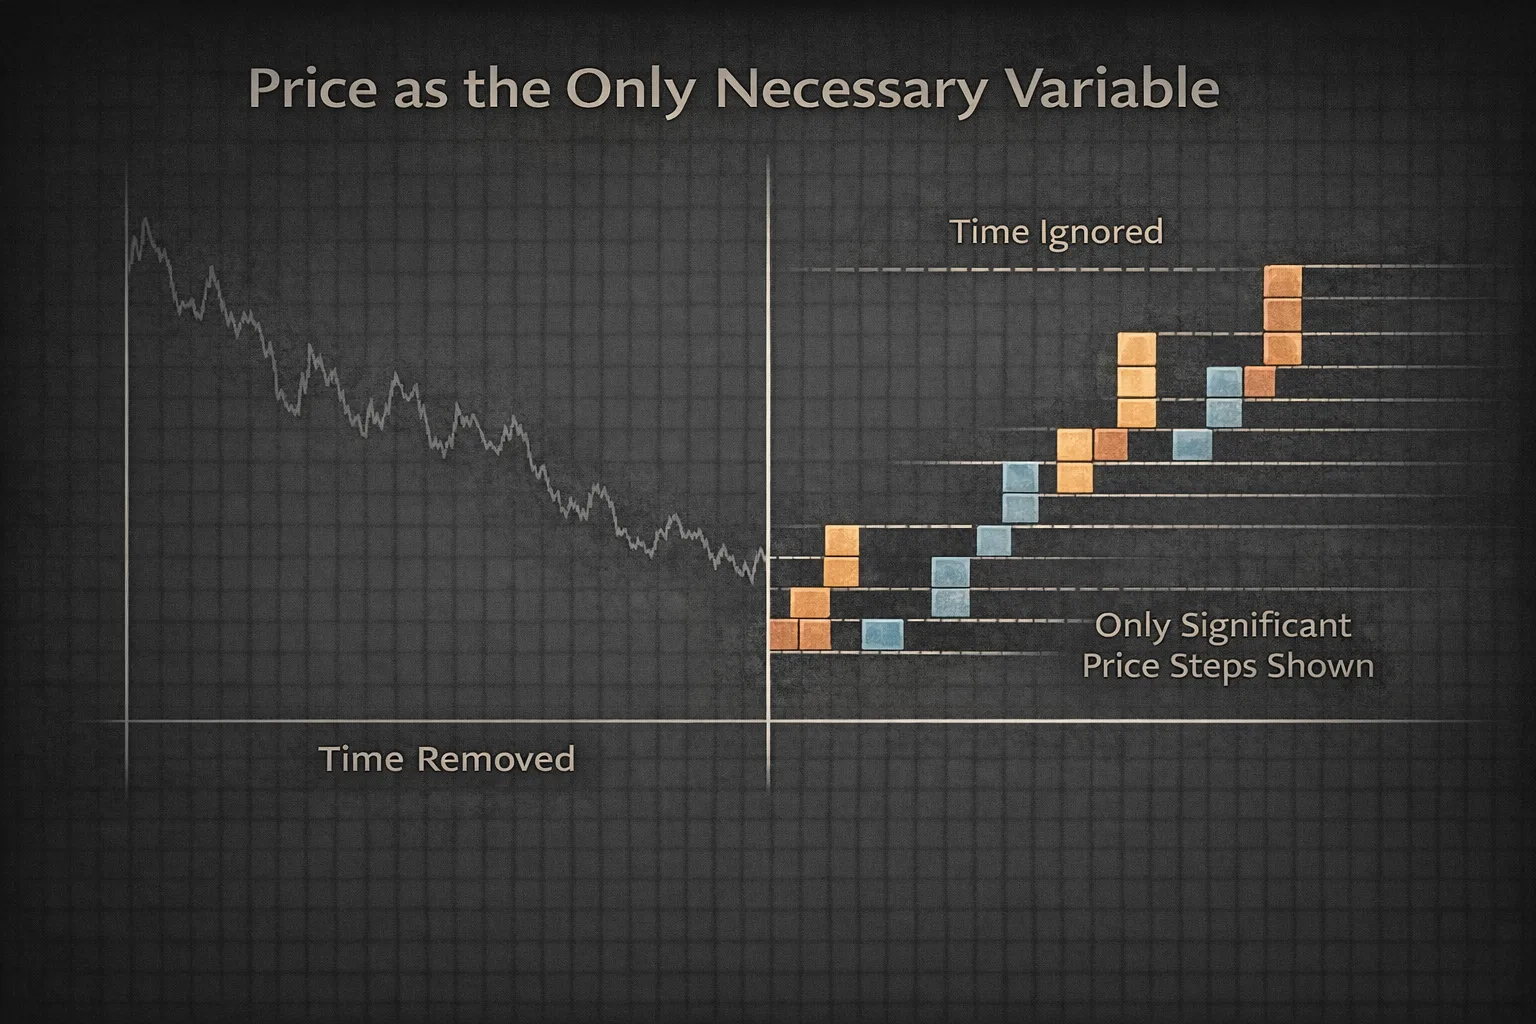
In Point-and-Figure charting, price is not one variable among many. It is the only variable that matters.
Time, volume, volatility, and momentum are not denied — they are subordinated. They influence price, but they do not deserve independent representation.
This design choice reflects a fundamental belief:
Markets decide in steps, not seconds.
Price must move enough to justify attention. Anything less is noise.
2. What Removing Time Actually Reveals
Removing time does not simplify markets.
It exposes their structure.
Time-based charts often confuse persistence with importance. A long-lasting sideways movement appears significant simply because it occupies screen space. In Point-and-Figure, duration without movement is invisible.
What remains are:
- decisive advances
- decisive declines
- failed attempts
- hesitation that matters
The chart becomes a record of decisions, not activity.
3. Columns as Market States
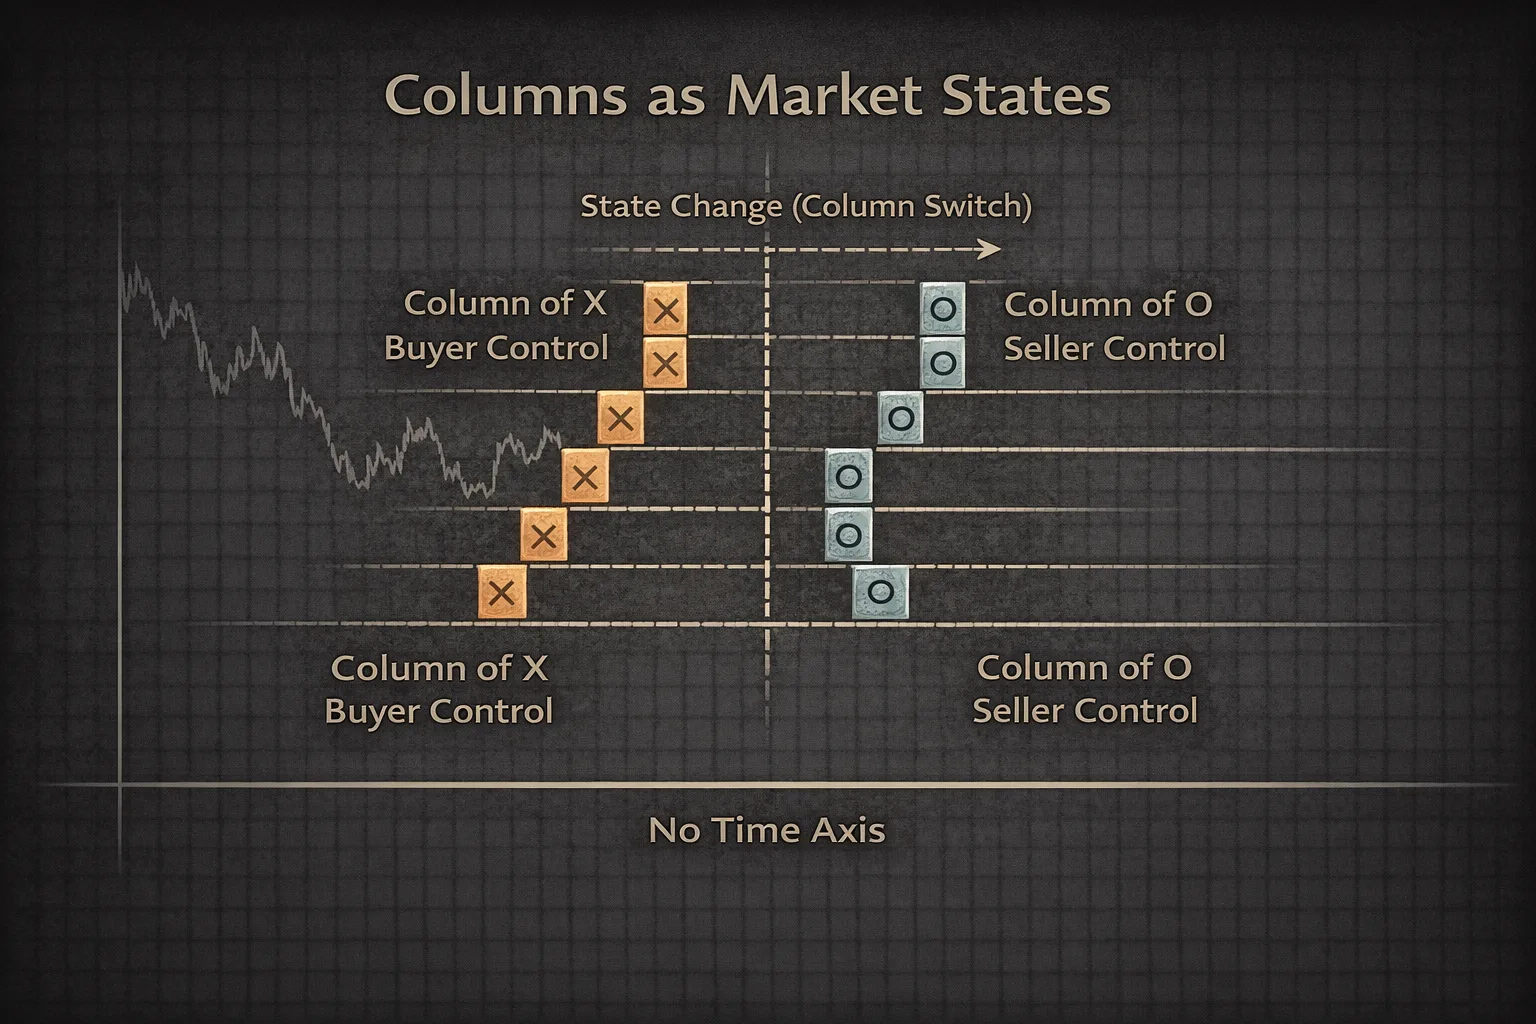
Each column in a Point-and-Figure chart represents dominance.
- A column of Xs means buyers are in control.
- A column of Os means sellers are in control.
This dominance is not symbolic. It must be paid for in price movement.
A column continues only while the dominant side can extend price far enough to justify another box. When it cannot, the market pauses. When the opposing side proves strength beyond a defined threshold, control changes.
This makes Point-and-Figure charts fundamentally state-based, not continuous.
4. Reversal as Structural Commitment
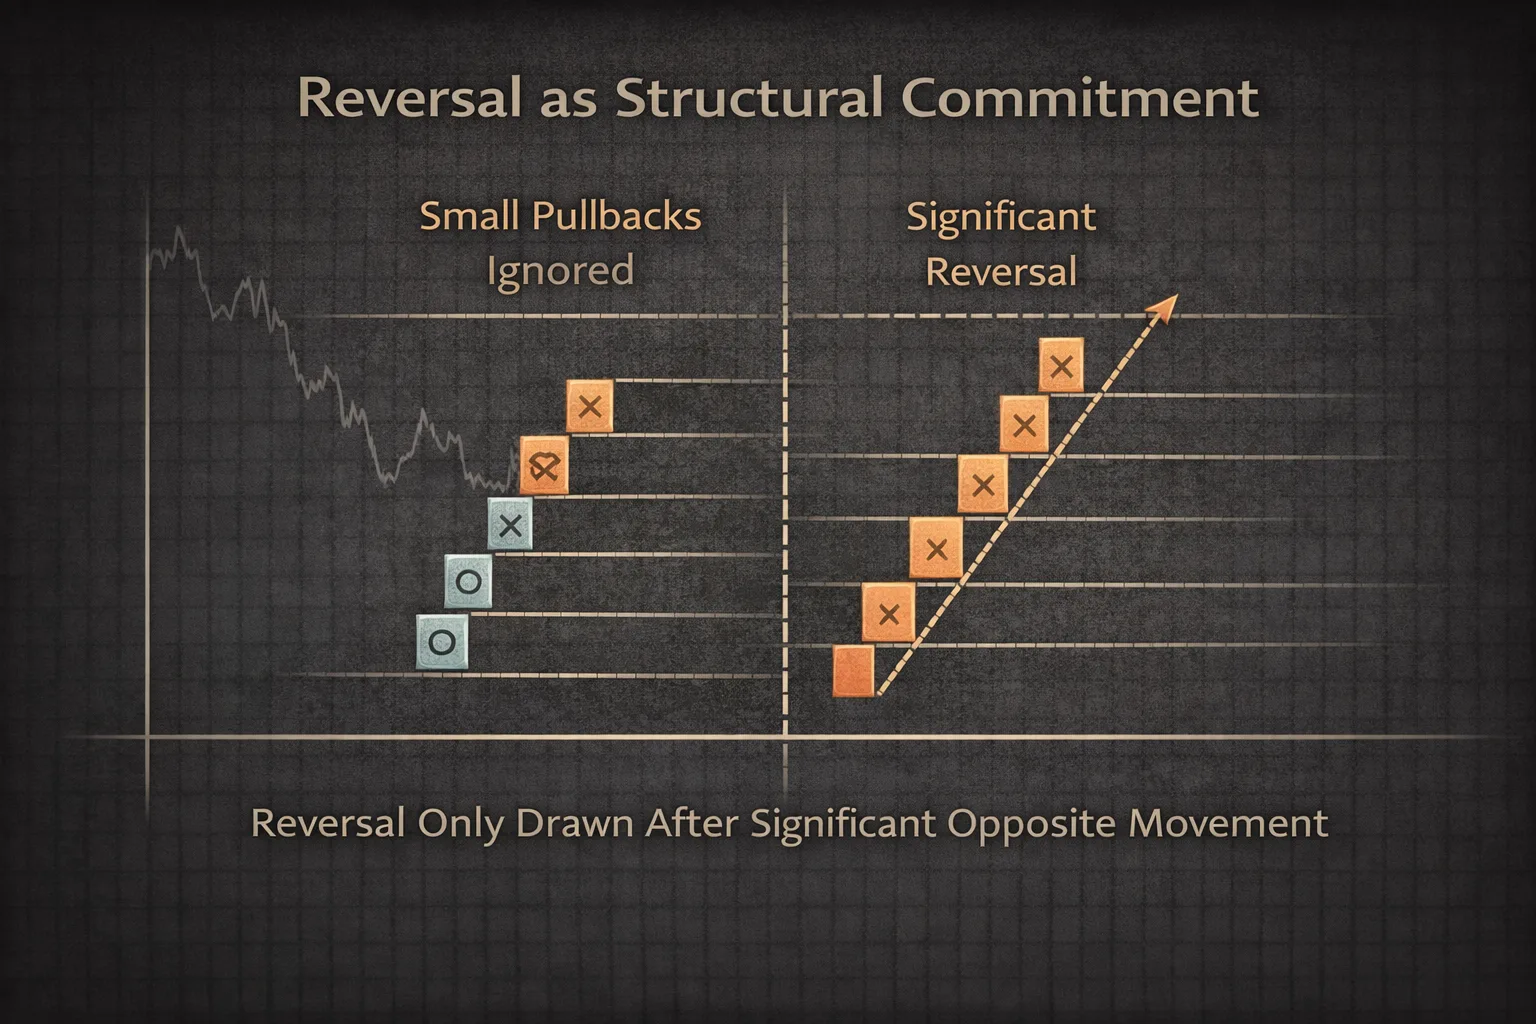
In time-based charts, reversals are ambiguous. A small retracement may look identical to a meaningful shift.
Point-and-Figure removes that ambiguity.
A reversal requires price to move far enough to:
- invalidate the prior state
- justify a new column
- prove commitment by the opposing side
This creates a natural hierarchy:
- minor reactions disappear
- only structurally relevant changes remain
Reversal is no longer interpretation. It is earned.
5. Trend as Persistence, Not Direction
In conventional analysis, trends are often defined by slope.
In Point-and-Figure, slope is irrelevant.
Trend is defined by:
- the number of boxes
- the ability to sustain dominance
- persistence over multiple columns
A slow, steady advance may produce a stronger trend than a sharp but brief move. Time does not amplify trends. Commitment does.
This aligns naturally with behavioral reality: conviction matters more than speed.
6. Congestion as Stored Energy
Sideways structures are not boredom.
They are unresolved negotiation.
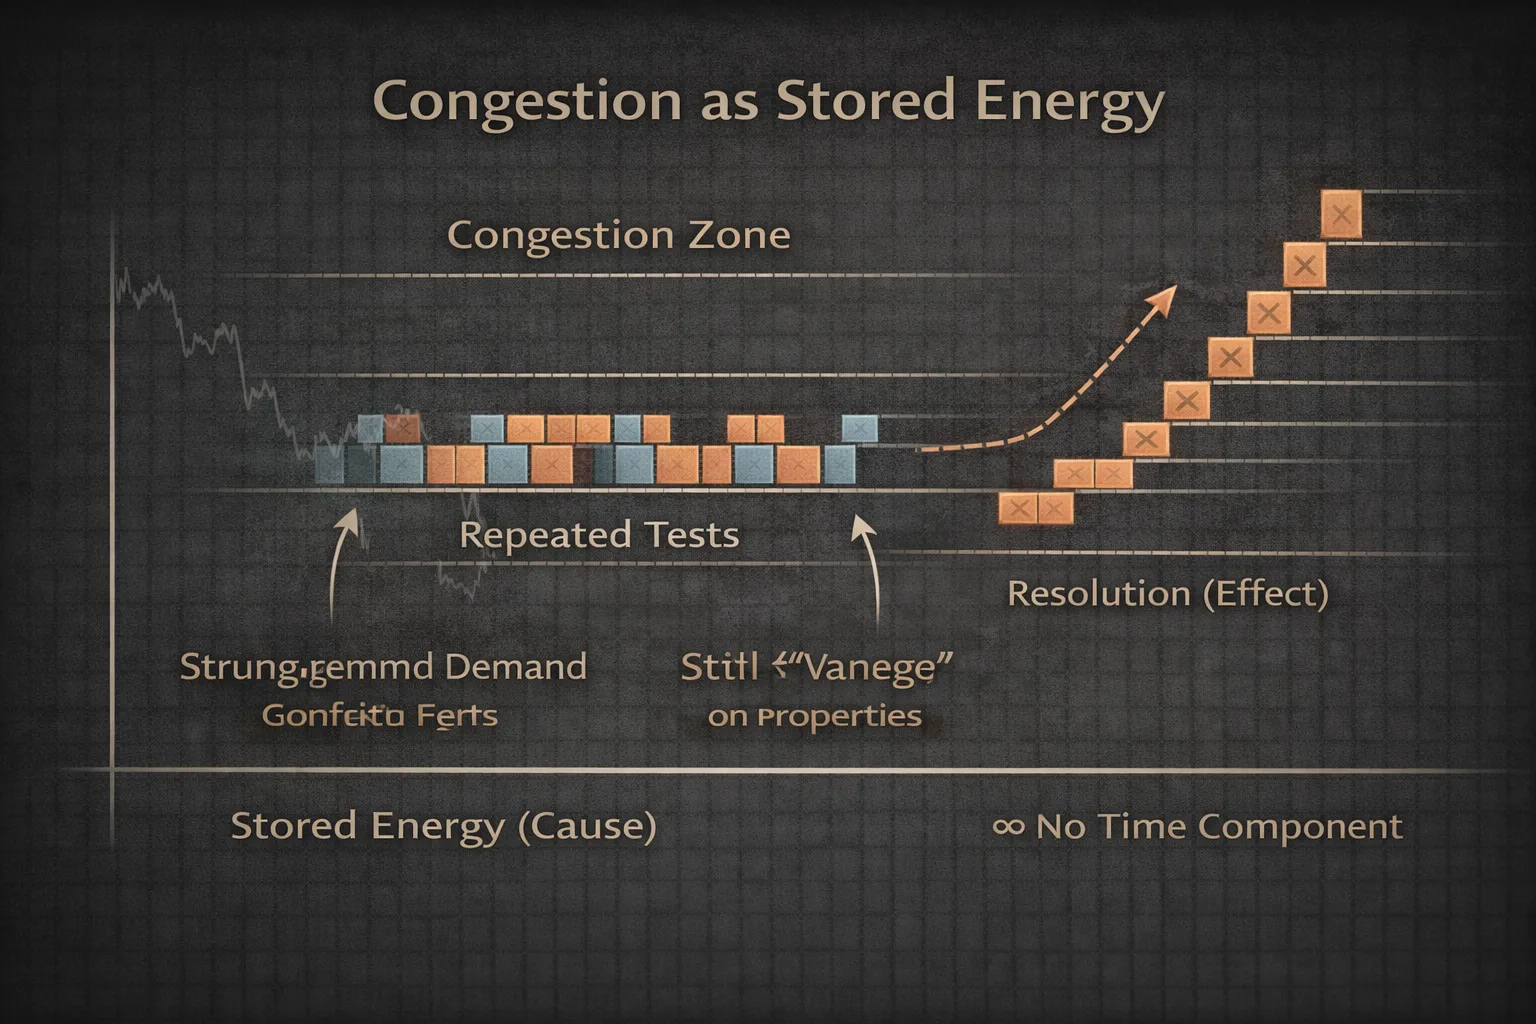
In Point-and-Figure, congestion zones are among the most informative features. They represent areas where:
- supply and demand repeatedly clash
- positions are transferred
- conviction slowly accumulates
The longer a congestion persists, the greater the structural consequence of its resolution. This is not prediction. It is measurement of potential.
Cause precedes effect.
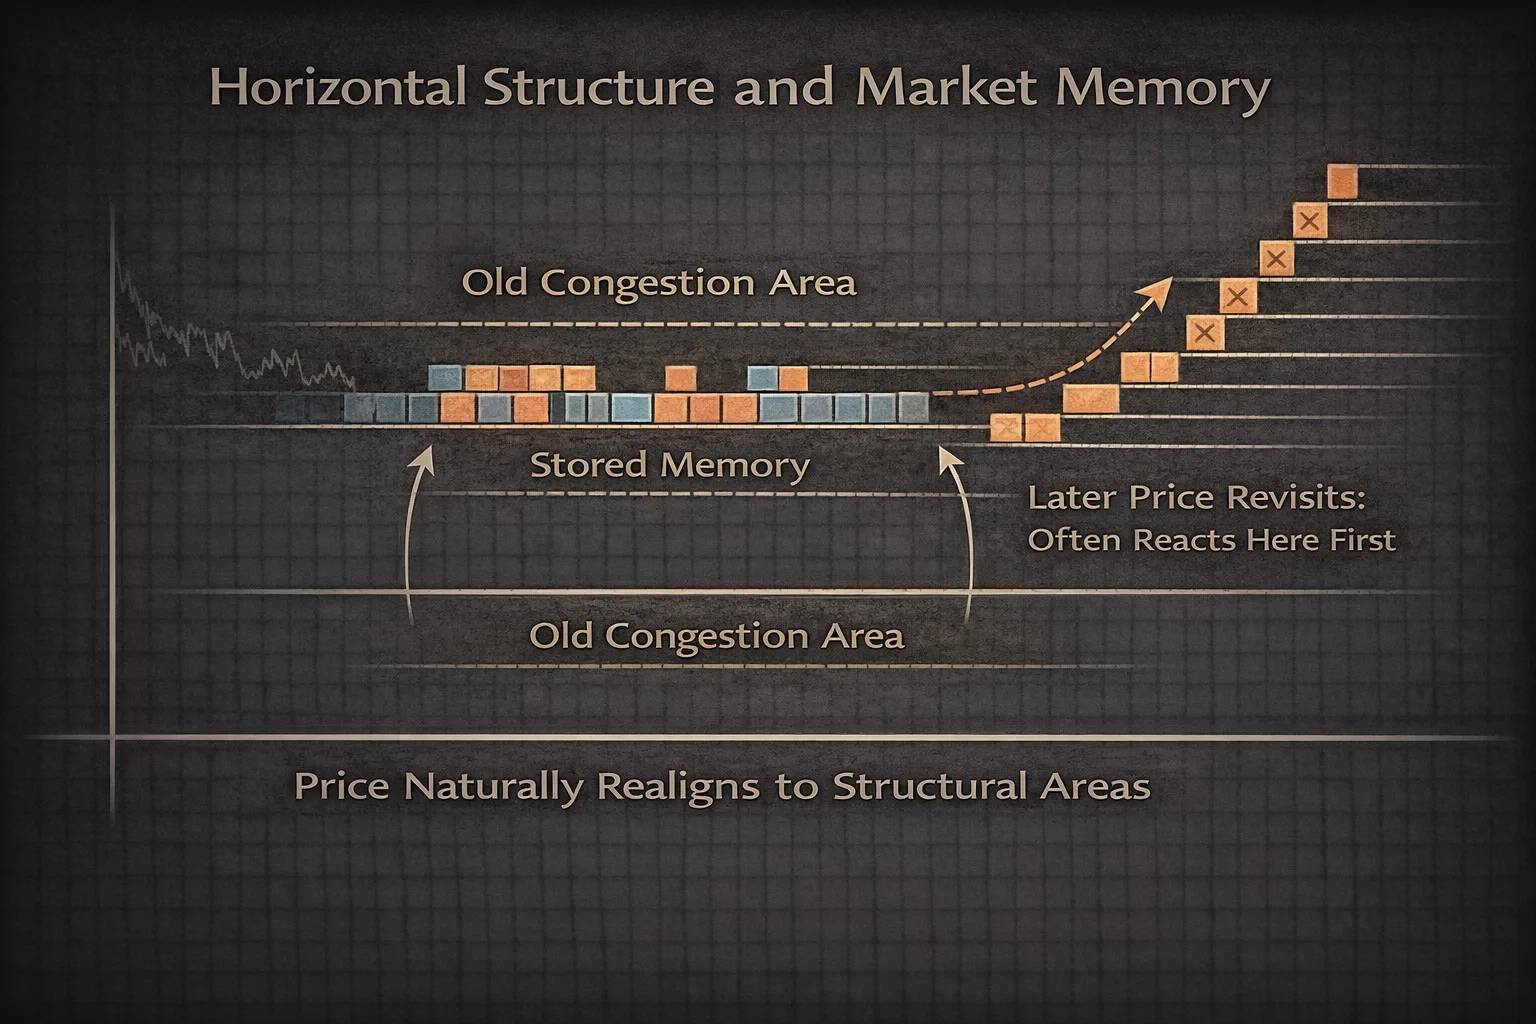
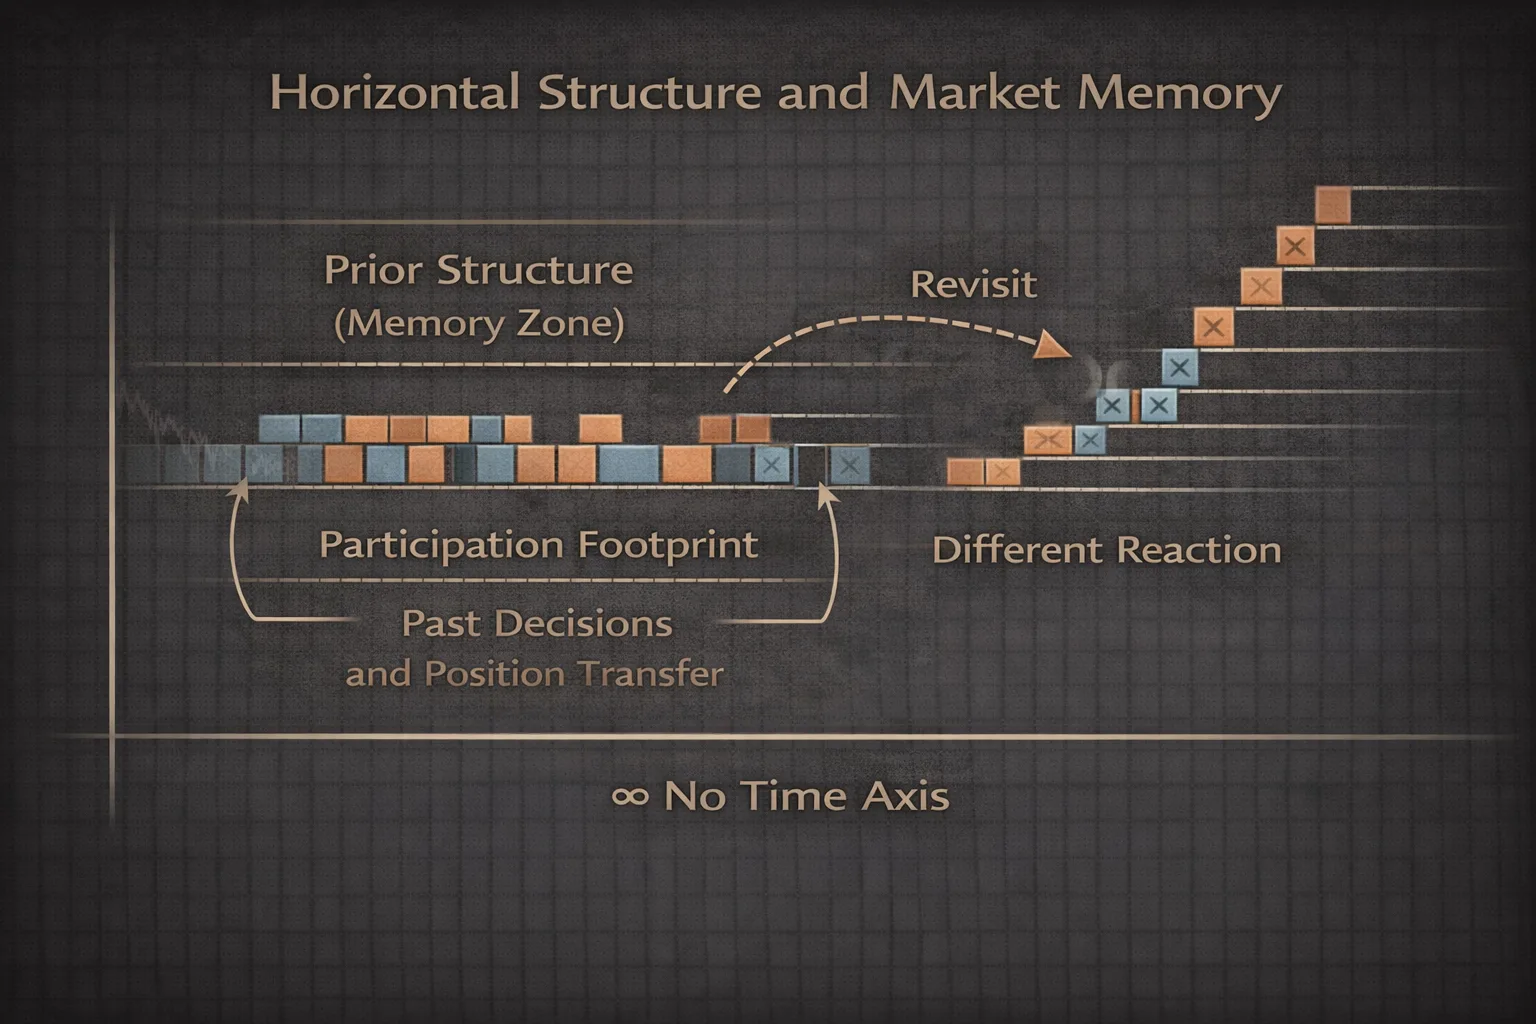
7. Horizontal Structure and Market Memory
Markets remember where effort was expended.
Horizontal structures in Point-and-Figure charts mark regions where:
- large numbers of decisions were made
- capital changed hands
- failure or success occurred repeatedly
When price later revisits these regions, reactions are rarely neutral. The market is responding not to price alone, but to stored behavioral memory.
This is why Point-and-Figure charts often appear eerily precise without being predictive.
8. False Breakouts as Structural Weakness
False breakouts are not errors.
They are diagnostics.
In Point-and-Figure, a failed breakout often leaves a clear structural signature:
- insufficient column extension
- rapid reversal
- lack of follow-through boxes
This does not indicate randomness. It indicates insufficient participation.
The chart does not explain why participation failed. It simply records that it did.
9. Why Point-and-Figure Is Uncomfortable
Point-and-Figure charts are uncomfortable because they deny constant feedback.
There is no candle to watch.
No bar closing every minute.
No indicator oscillating.
The trader must wait for the market to earn representation.
This discomfort is not a flaw. It is the point.
10. Relationship to Swing Cycles
Swing cycles exist regardless of chart type.
Point-and-Figure simply renders them without temporal distortion.
Swings appear as:
- column changes
- failed extensions
- structural pauses
Because time is removed, swings are measured by price effort, not duration. This makes P&F especially aligned with swing-trading logic rooted in market structure rather than timing.
11. Point-and-Figure and Crowd Psychology
Point-and-Figure charts are crowd maps.
Each box represents:
- another group committing capital
- another layer of belief
- another threshold crossed
Absence of boxes represents hesitation.
The chart visualizes collective conviction, not individual emotion. It does not show fear or greed directly. It shows the price paid for those emotions.
12. When Point-and-Figure Works Best
Point-and-Figure excels in environments where:
- structure matters more than speed
- trends persist
- crowd behavior dominates microstructure
It is less effective in:
- ultra-short-term noise
- news-driven spikes
- environments where price jumps without negotiation
This is not a limitation. It is selectivity.
Conclusion: Markets Decide in Steps, Not Seconds
Point-and-Figure charting survives not because it is old, but because it is honest.
Markets do not move continuously.
They decide, hesitate, commit, and reverse.
By removing time, Point-and-Figure charts force attention onto what truly matters:
- decision
- commitment
- structural consequence
In a world obsessed with immediacy, Point-and-Figure remains valuable precisely because it refuses to hurry.