Benchmarking My Multi-Market Algorithmic Portfolio Against Darwinex INDX
A portfolio is not only about finding profitable strategies. It is about understanding whether the whole system creates value compared to a realistic benchmark, how diversified the sources of return are, and whether the portfolio can survive when market regimes change.
Why I Need a Portfolio Benchmark
When I test a strategy on the S&P 500, the natural benchmark is the S&P 500 index itself. If the index returned 40% over five years and my active strategy returned 60% over the same period, I have a clear reference point. The strategy did not exist in isolation. It was measured against a passive alternative.
With a multi-market algorithmic portfolio, the comparison becomes more difficult. My portfolio is not a single index strategy. It combines different instruments, sectors and trading behaviours. That is why I started looking at Darwinex INDX as a useful portfolio-level benchmark: not because it trades the same exact markets, but because it represents a diversified, actively managed trading portfolio with a transparent performance curve.
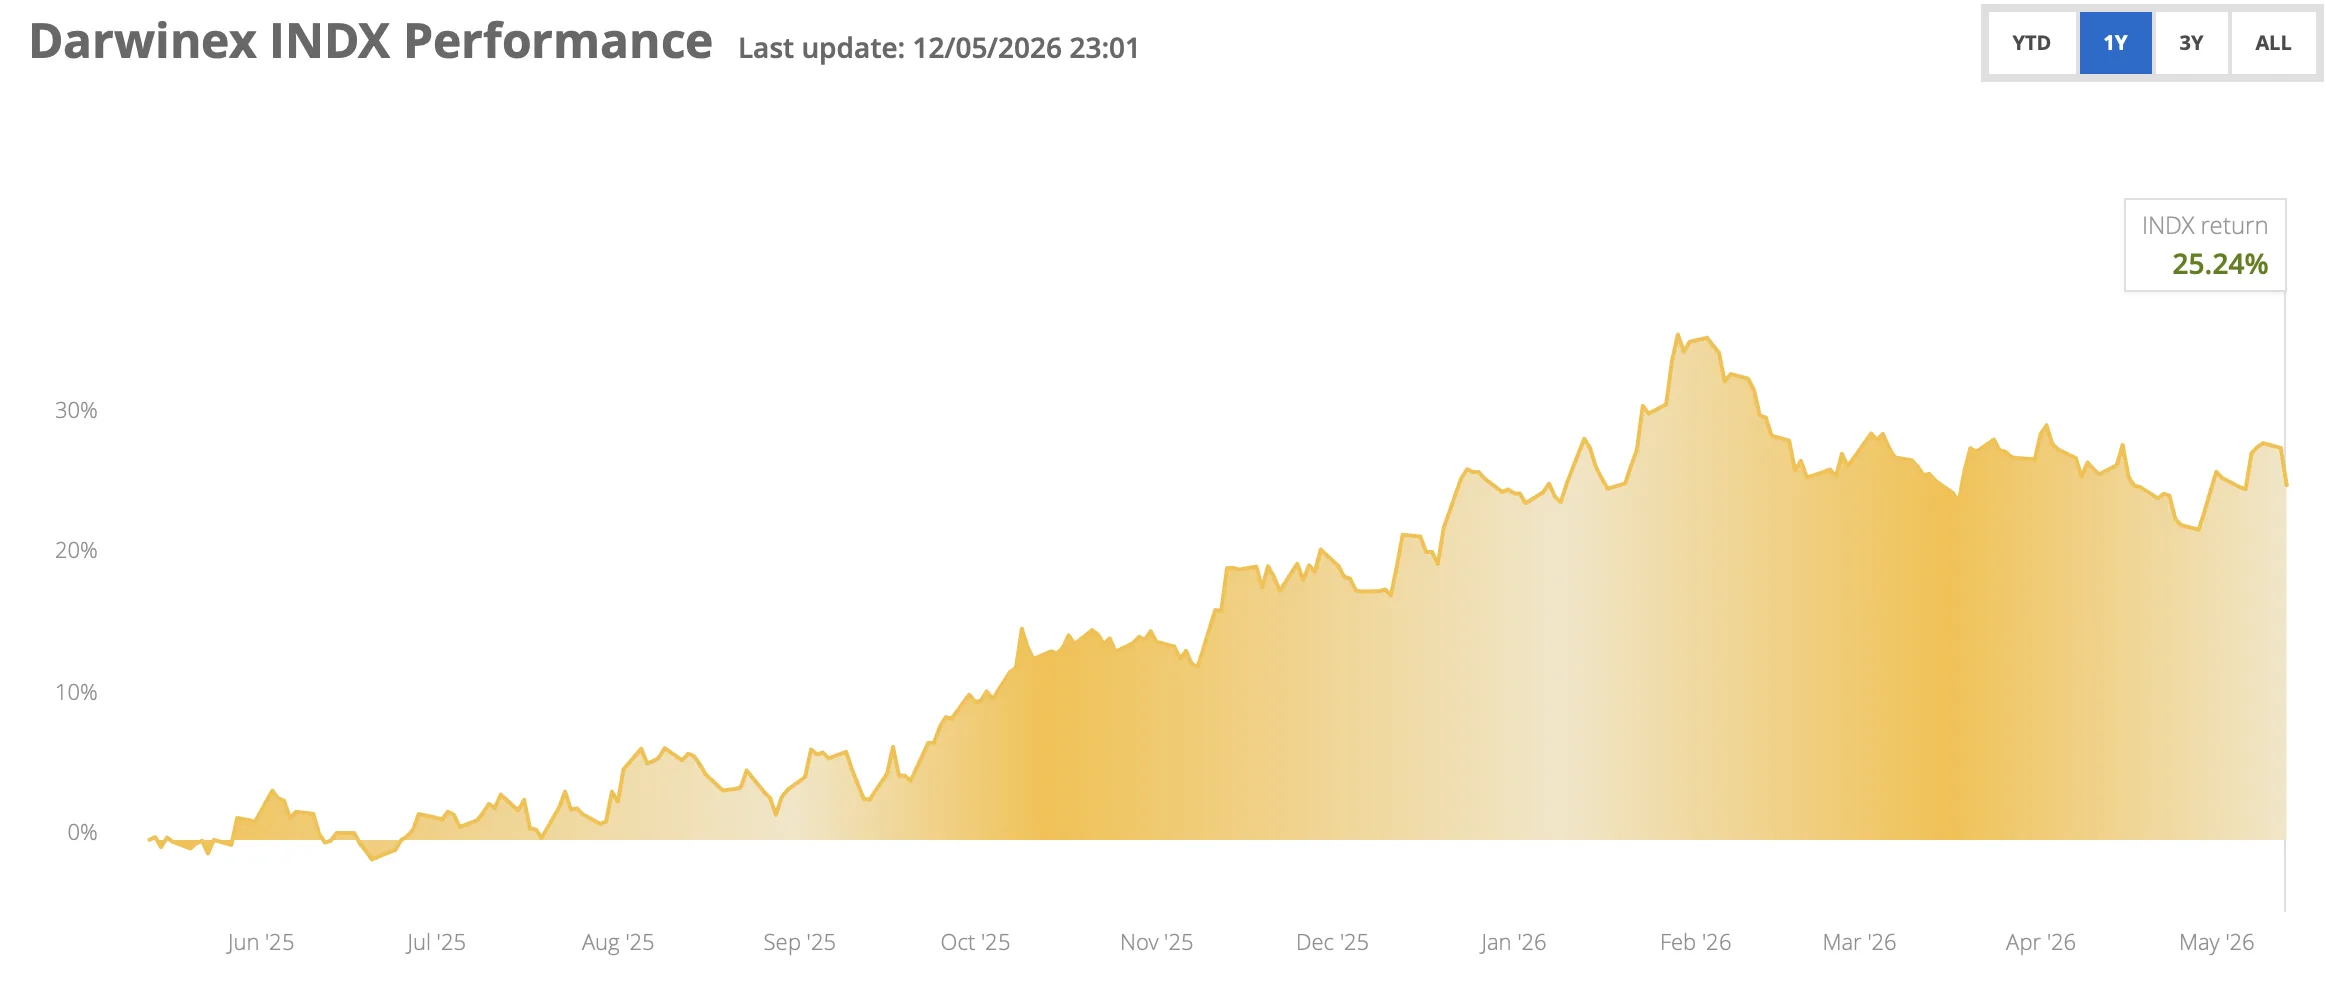
The 1-year Darwinex INDX performance screenshot used in this comparison shows a positive return of 25.24%. This gives me a practical reference point for evaluating my own portfolio curve.
What Darwinex INDX Represents
Darwinex INDX is useful for this type of comparison because it is not a single trading system. It is a managed portfolio of DARWIN strategies. In other words, it is already a diversified trading product, not a simple buy-and-hold exposure to one market.
For my analysis, I do not treat INDX as an exact replica of my trading universe. I treat it as a performance-transparent diversified trading benchmark. The question is simple: if another diversified trading portfolio can generate a certain return and risk profile, how does my own systematic portfolio compare?
What My Portfolio Represents
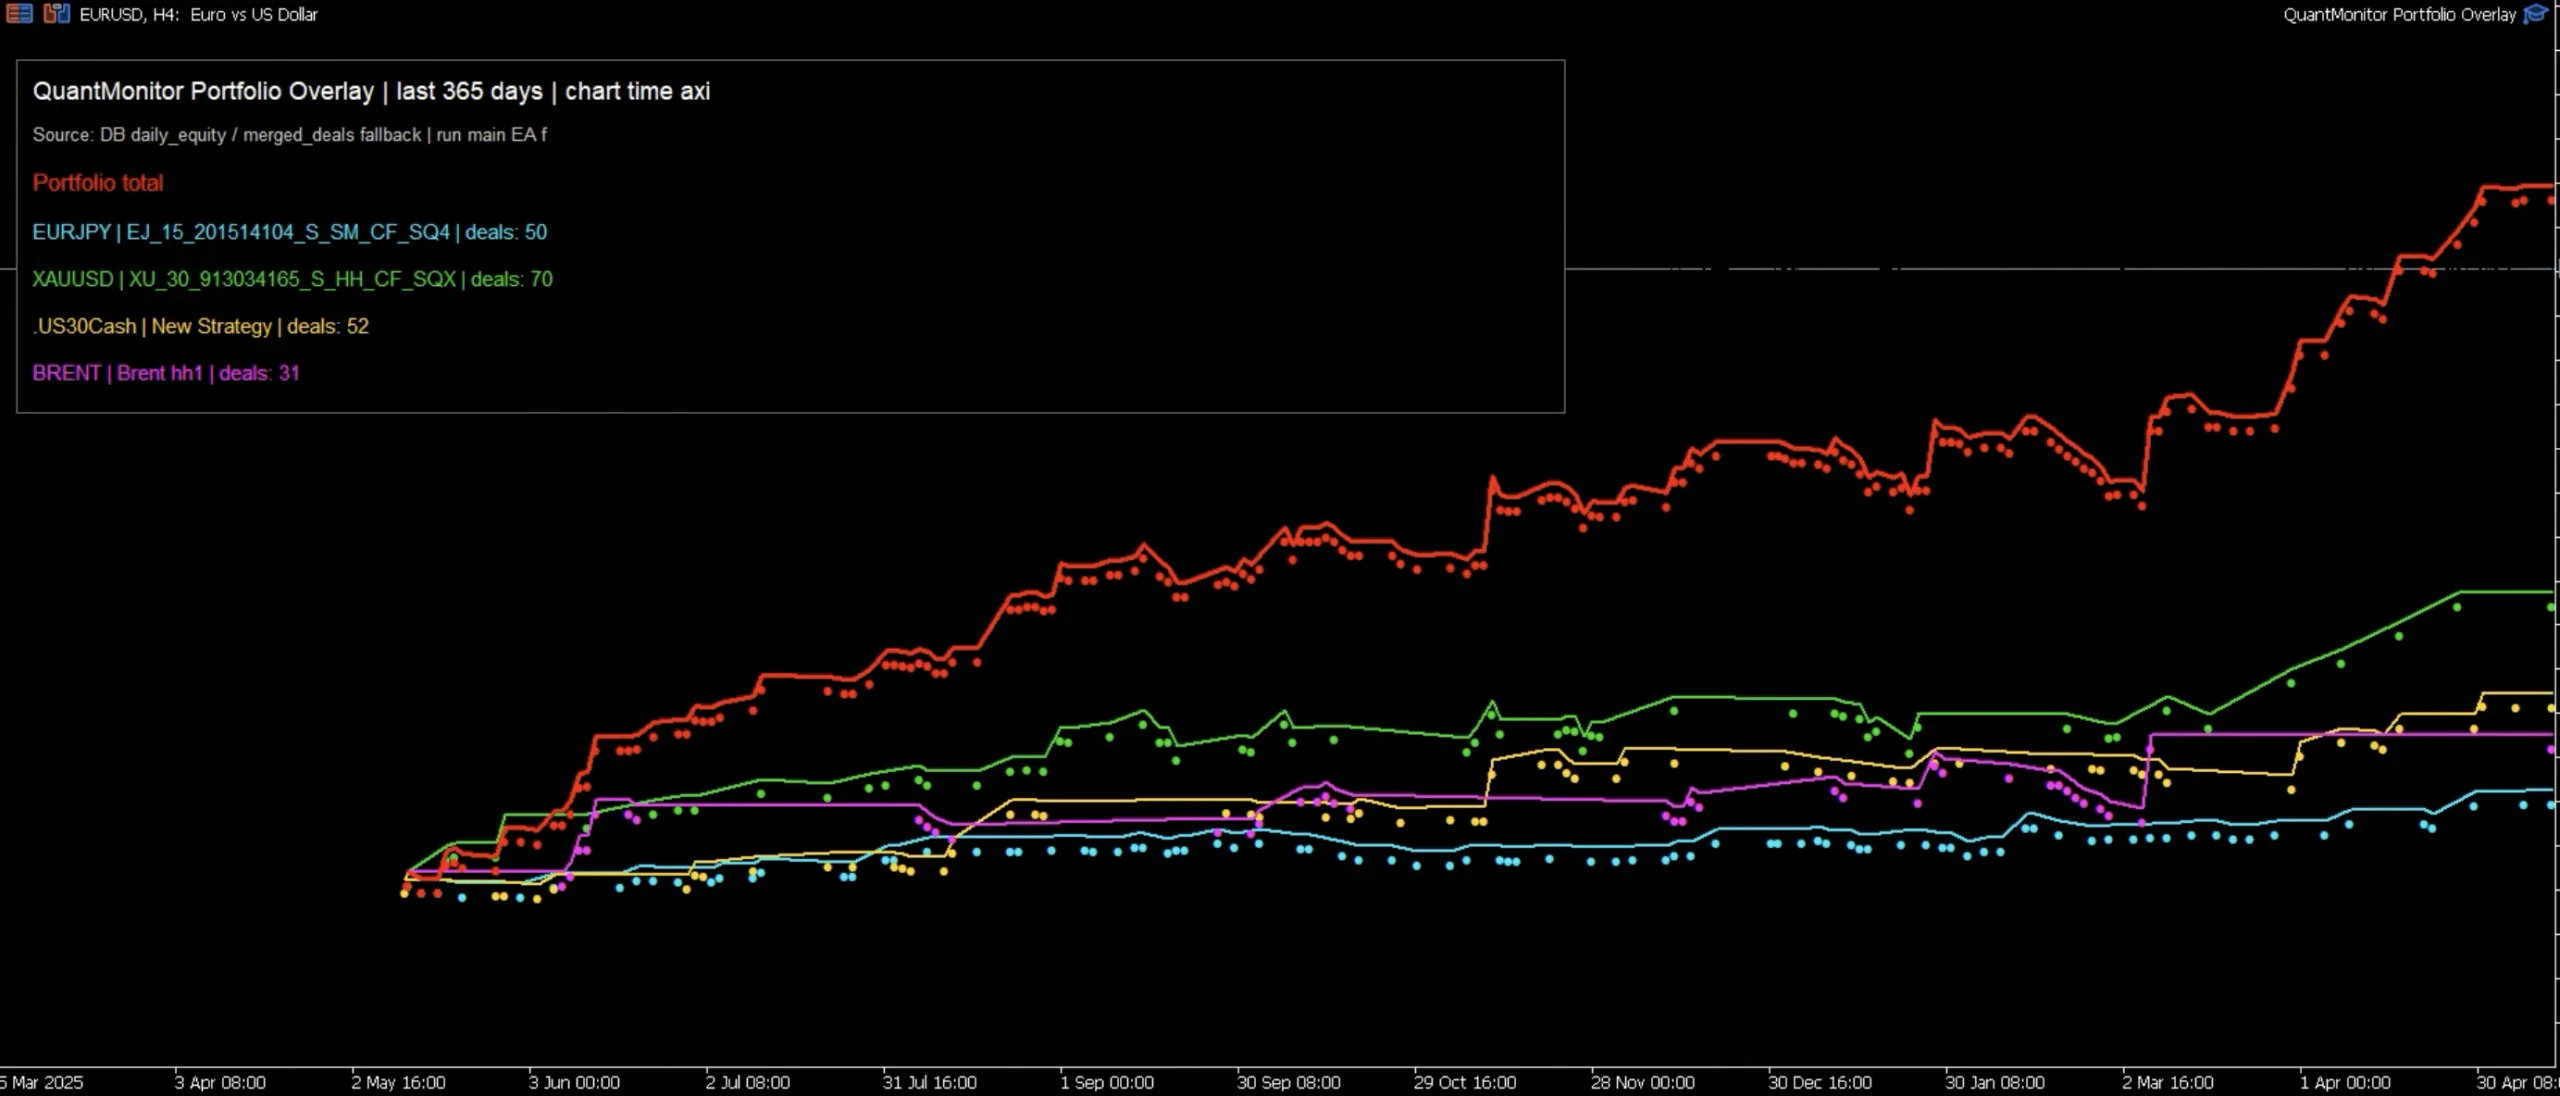
My current portfolio is built from separate algorithmic strategies across different markets and sectors. In the QuantMonitor Portfolio Overlay screenshot, the portfolio contains:
This structure is important. I do not want all strategies to depend on one market, one volatility regime, one macro theme or one type of price behaviour.
| Benchmark / Portfolio | Role in the Comparison | Main Strength | Main Limitation |
|---|---|---|---|
| Darwinex INDX | External diversified trading benchmark | Professionally managed diversified portfolio of trading strategies with a visible performance curve | It is not identical to my market universe, execution model or strategy selection process |
| QuantMonitor Portfolio | My own actively traded multi-market system | Full control over strategies, markets, risk allocation and live monitoring | Requires continuous monitoring of market regimes, correlations and live execution quality |
| Traditional index benchmark | Useful for single-market strategies | Simple and intuitive comparison, for example active S&P 500 strategy vs. S&P 500 index | Less relevant for a diversified algorithmic portfolio trading FX, metals, indices and energy |
Why Diversification Is Not Just “More Strategies”
In the past, I have worked on projects where index-based algorithmic portfolios achieved very high returns, even around 100% in four months. When the market regime is favourable for the algorithms, this is possible. The problem appears when the regime changes.
If all systems are built on similar behaviour, the portfolio can look diversified while the market is favourable, but become highly correlated exactly when losses start. Strategies that seemed independent can suddenly lose at the same time because they are exposed to the same hidden driver: trend breakdown, volatility expansion, liquidity change, spread change, or a shift from directional to mean-reverting behaviour.
Market Diversification
Different symbols react to different macro drivers. Gold, oil, equity indices and FX pairs are not the same economic exposure.
Strategy Diversification
It is not enough to trade four symbols if every strategy uses the same logic and fails in the same market phase.
Regime Diversification
A robust portfolio should not depend on only one environment, such as a strong trend or low-volatility expansion.
The Real Question: Why Is the Portfolio Making or Losing Money?
Portfolio management becomes meaningful only when I can explain the behaviour of the portfolio. I need to know:
- Which markets are currently in favourable or unfavourable regimes?
- Which strategies historically perform well in those regimes?
- Are current losses isolated, or are they becoming correlated across the portfolio?
- Is performance coming from one dominant market, or from several independent return streams?
- Is the live portfolio behaving similarly to the backtest and forward-test expectations?
This is why I created tools such as QuantMonitor Portfolio Overlay EA and Market Regime Dashboard for MT5. The goal is not only to display profit. The goal is to understand the source of profit and the source of risk.
How QuantMonitor Portfolio Overlay EA Helps
QuantMonitor Portfolio Overlay EA allows me to compare individual strategies and the total portfolio directly inside MetaTrader 5. Instead of looking only at closed trades or account balance, I can see the portfolio as a living system.
- It displays the total portfolio curve.
- It overlays individual strategy components.
- It helps identify whether the portfolio is truly diversified.
- It makes loss clusters visible.
- It allows comparison of live trading behaviour with expected historical behaviour.
Why This Matters in Live Trading
A single strategy report can look excellent. But real portfolio risk appears when multiple strategies interact with each other. A portfolio can be profitable overall while one component is weakening. It can also look stable until several components begin to lose together.
The overlay view gives me a better decision-making layer. I can see whether diversification is working, whether the strongest component is carrying the whole portfolio, and whether a temporary drawdown is normal or a sign of regime mismatch.
| Portfolio Component | Sector / Exposure | Trades in Screenshot | Why It Matters |
|---|---|---|---|
| EURJPY | FX / currency cross | 50 | Provides exposure to currency flows and rate expectations outside USD-only pairs |
| XAUUSD | Metals / gold | 70 | Often reacts differently to risk sentiment, inflation expectations and macro uncertainty |
| US30Cash | Equity index | 52 | Represents equity market momentum, risk-on/risk-off behaviour and index volatility |
| BRENT | Energy / oil | 31 | Adds commodity and energy-sector exposure, often driven by different supply-demand factors |
| Total | Multi-sector algorithmic portfolio | 203 | Allows portfolio-level analysis instead of judging each strategy in isolation |
Connecting This to Market Regime Analysis
The next layer of portfolio management is regime awareness. I need to know whether a market is trending, ranging, volatile, compressed, liquid, unstable or structurally different from the environment where the strategy was built.
I wrote more about this in the article How to Identify Market Regimes and Filter Strategies by Trend and Volatility . This is directly connected to portfolio benchmarking. If my portfolio underperforms Darwinex INDX or another benchmark, I do not want to simply say “the strategy is bad”. I want to understand whether the current market regime is unfavourable for my strategy set.
What I Want to Measure
- Portfolio return over the same period as the benchmark
- Maximum drawdown and recovery speed
- Contribution of each market to total performance
- Correlation of losses between strategies
- Behaviour during different volatility and trend regimes
- Difference between backtest expectations and live execution
What I Do Not Want to Do
- I do not want to chase only the highest return.
- I do not want to add more strategies just to make the portfolio look diversified.
- I do not want to ignore drawdown clustering.
- I do not want to compare my portfolio only against itself.
- I do not want to keep a strategy active when the market regime clearly stopped supporting it.
My Portfolio Management Framework
The framework is simple:
- Build strategies per market with realistic symbol settings, spreads, commissions and execution assumptions.
- Monitor live trading and compare it with historical expectations.
- Overlay the portfolio to see the total equity curve and individual components together.
- Compare the result with an external benchmark, such as Darwinex INDX.
- Analyse market regimes to understand why strategies are making or losing money.
- Adjust allocation only when there is a clear data-based reason, not because of emotional reaction to short-term noise.
Conclusion
Comparing my own algorithmic portfolio with Darwinex INDX is not about copying Darwinex or claiming that both portfolios are the same. It is about building a serious benchmark mindset.
A trader who manages only one strategy can compare it to one market. A portfolio manager needs a broader view. The portfolio must be measured against a realistic alternative, analysed across market regimes, and monitored for hidden correlations.
This is exactly why I built QuantMonitor Portfolio Overlay EA for MetaTrader 5. It helps me move from individual strategy analysis to portfolio-level decision making. In live algorithmic trading, the most important question is not only whether the portfolio is currently profitable. The most important question is whether I understand why it is profitable, where the risk is coming from, and when the market regime is changing.