A market-regime filter is a rule that only lets a strategy trade when the market is in a favourable state. QuantMonitor’s version switches a strategy on only when the 50-period SMA is rising (SMA(50)[0] – SMA(50)[5] > 0) and current volatility is below average (ATR(14)/Close under its own 100-period average) — otherwise the strategy is turned off (StrategyEnabled = 0).
The exact market-regime filter formula
IF (SMA(50)[0] – SMA(50)[5]) > 0
   AND (ATR(14)[0] / Close[0]) < MA(ATR(14)[0] / Close[0], 100)
THEN StrategyEnabled = 1
ELSE StrategyEnabled = 0
Recommended values for a market-regime filter
| Parameter | Value | Why |
|---|---|---|
| SMA period | 50 | Defines the trend baseline — a rising 50-period SMA marks an up-trend. |
| Trend lookback | 5 bars | Slope window: SMA(50)[0] minus SMA(50)[5] > 0 confirms the trend is rising, not flat. |
| ATR period | 14 | Measures current volatility, expressed as ATR% = ATR(14) / Close. |
| Volatility baseline | 100-bar MA of ATR% | The regime counts as low volatility only when ATR% is below its own 100-period average. |
| StrategyEnabled | 1 / 0 | Master switch: the strategy trades (1) only when both the trend and volatility tests pass; otherwise it stands aside (0). |
How to add a market-regime filter to a StrategyQuant strategy
- Open your strategy in StrategyQuant X (AlgoWizard or the strategy editor) and locate the entry conditions.
- Add an SMA(50) indicator referenced at two shifts, and create the trend condition
SMA(50)[0] > SMA(50)[5]to detect a rising trend. - Add an ATR(14) indicator and divide it by
Closeto build the relative-volatility value ATR%. - Add a 100-bar moving average of that ATR% value to serve as the volatility baseline.
- Create the volatility condition
ATR% < MA(ATR%, 100)so it passes only when current volatility is below average. - Combine both conditions with AND on the entry signal, so trades fire only when the filter equals 1.
- For reuse, wrap the whole rule in a StrategyQuant X Custom Block / custom indicator in the Code Editor so it returns a single 1/0 flag you can drop into any strategy.
- Re-run the backtest with and without the filter and compare the equity curves and drawdown before committing it live.
New to the platform? See our free StrategyQuant trial guide to set up the software first.
🔍 Introduction
One of the key factors that determines whether an algorithmic strategy succeeds or stagnates is not the entry signal itself, but the market context in which it operates.
In other words — when the system trades is often more important than how it trades.
In this article, we’ll build a simple but highly effective market regime filter based on classic indicators:
- Trend direction (SMA50)
- Volatility level (ATR%)
The goal is to create a logic that keeps your strategy running only when the market is trending calmly (e.g. Up_LowVol) and pauses it during chaotic or bearish phases.
⚙️ Core Concept: Market Regime Filter
1️⃣ Trend Condition
To determine whether the market is in an uptrend or downtrend, we use the 50-day simple moving average (SMA50) of the underlying index (e.g. NASDAQ100 / USTECHCash).
The trend is considered bullish (Up) when the SMA50 is rising:
SMA(50)[0] – SMA(50)[5] > 0
That means the 50-day average is higher today than it was 5 days ago.
2️⃣ Volatility Condition
For volatility, we use ATR(14) (Average True Range), expressed as a percentage of the current price:
ATR%(t) = ATR(14)[t] / Close[t]
This shows the average daily range as a percentage of price.
For example, ATR% = 0.009 → the market moves ±0.9 % per day on average.
We then compare current volatility to its 100-day average:
(ATR(14)[0] / Close[0]) < MA(ATR(14)[0] / Close[0], 100)
If the current ATR% is below its long-term average, volatility is “low.”
3️⃣ Combined Logic
The complete filter rule is:
IF (SMA(50)[0] – SMA(50)[5]) > 0 AND
(ATR(14)[0] / Close[0]) < MA(ATR(14)[0] / Close[0], 100)
THEN StrategyEnabled = 1
ELSE StrategyEnabled = 0
✅ The strategy is enabled when the market is trending up and volatility is below average.
❌ Otherwise, it remains disabled (no new positions opened).
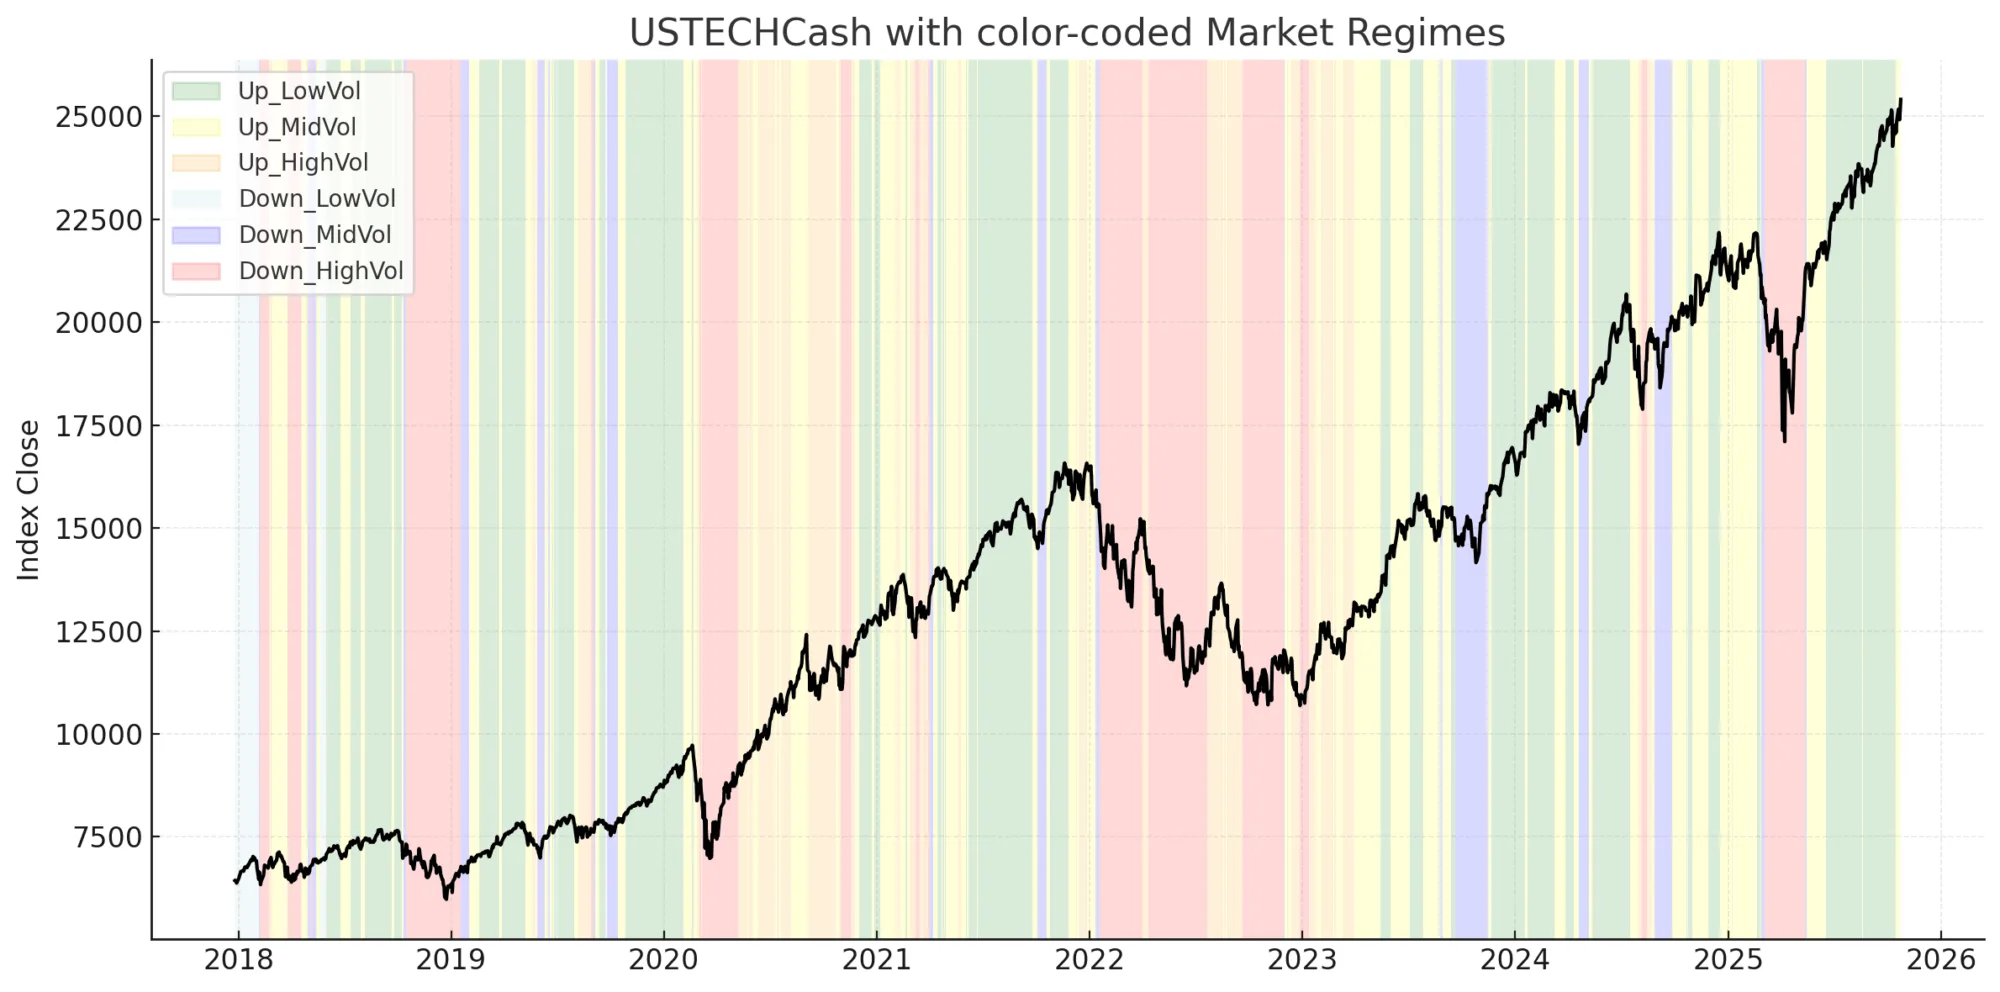
📊 Example: NASDAQ (USTECHCash)
We applied this filter to NASDAQ (USTECHCash) daily data, calculating:
- TrendSlope = SMA(50) − SMA(50)[−5]
- ATR% = ATR(14)/Close
- ATR% MA(100) = 100-day moving average of ATR%
- StrategyEnabled = logic result from the above filter
and combined it with the equity curve of a live trading strategy.
🧩 Results by Market Regime

| Market Regime | Days | Total Profit | Filter Active (%) | Enabled Days |
|---|---|---|---|---|
| Up_LowVol | 556 | 219 | 95.5 % | 531 |
| Up_MidVol | 512 | 143 | 59 % | 303 |
| Up_HighVol | 270 | 71 | 59 % | 160 |
| Down_MidVol | 153 | 116 | 0 % | 0 |
| Down_HighVol | 404 | 59 | 0 % | 0 |
| Down_LowVol | 35 | 19 | 0 % | 0 |
🧠 Interpretation
- Up_LowVol (bullish + calm)→ Strategy runs ~95 % of the time and generates the largest profit.Ideal “core” regime.
- Up_MidVol / Up_HighVol (bullish + choppy)→ Strategy trades about 60 % of the time, focusing on quieter sub-periods within volatile uptrends.
- Down_*→ Filter completely disables trading.The system stays out during bear or chaotic conditions.
This behavior is exactly what we want:
trade only in stable, rising environments and pause during turbulence.
💡 Summary
| Metric | Without Filter | With Market Filter |
|---|---|---|
| Active Trading Days | 100 % | ~55 % |
| Drawdown | Higher | Significantly lower |
| Stagnation | Frequent | Reduced |
| Market Awareness | None | Context-aware |
| Best For | Any system | Momentum / Breakout |
📘 Conclusion
A market regime filter built from simple SMA(50) and ATR% logic
is a powerful and lightweight tool to stabilize performance.
It helps your strategy trade only when conditions are statistically favorable and stay flat when the environment turns hostile.
This approach can be implemented directly in StrategyQuant X,
as a custom filter indicator, or even as an external signal module for MT5 or TradingView.
🚀 Real-World Validation
This approach to market regime analysis isn’t just theoretical.
About a year ago, I applied this exact framework — combining trend slope and volatility filters — in my live algorithmic trading project focused on the U.S. indices portfolio.
By accurately identifying the Up-LowVol regime and dynamically scaling exposure only during favorable conditions, the system achieved over +100 % performance within several months.
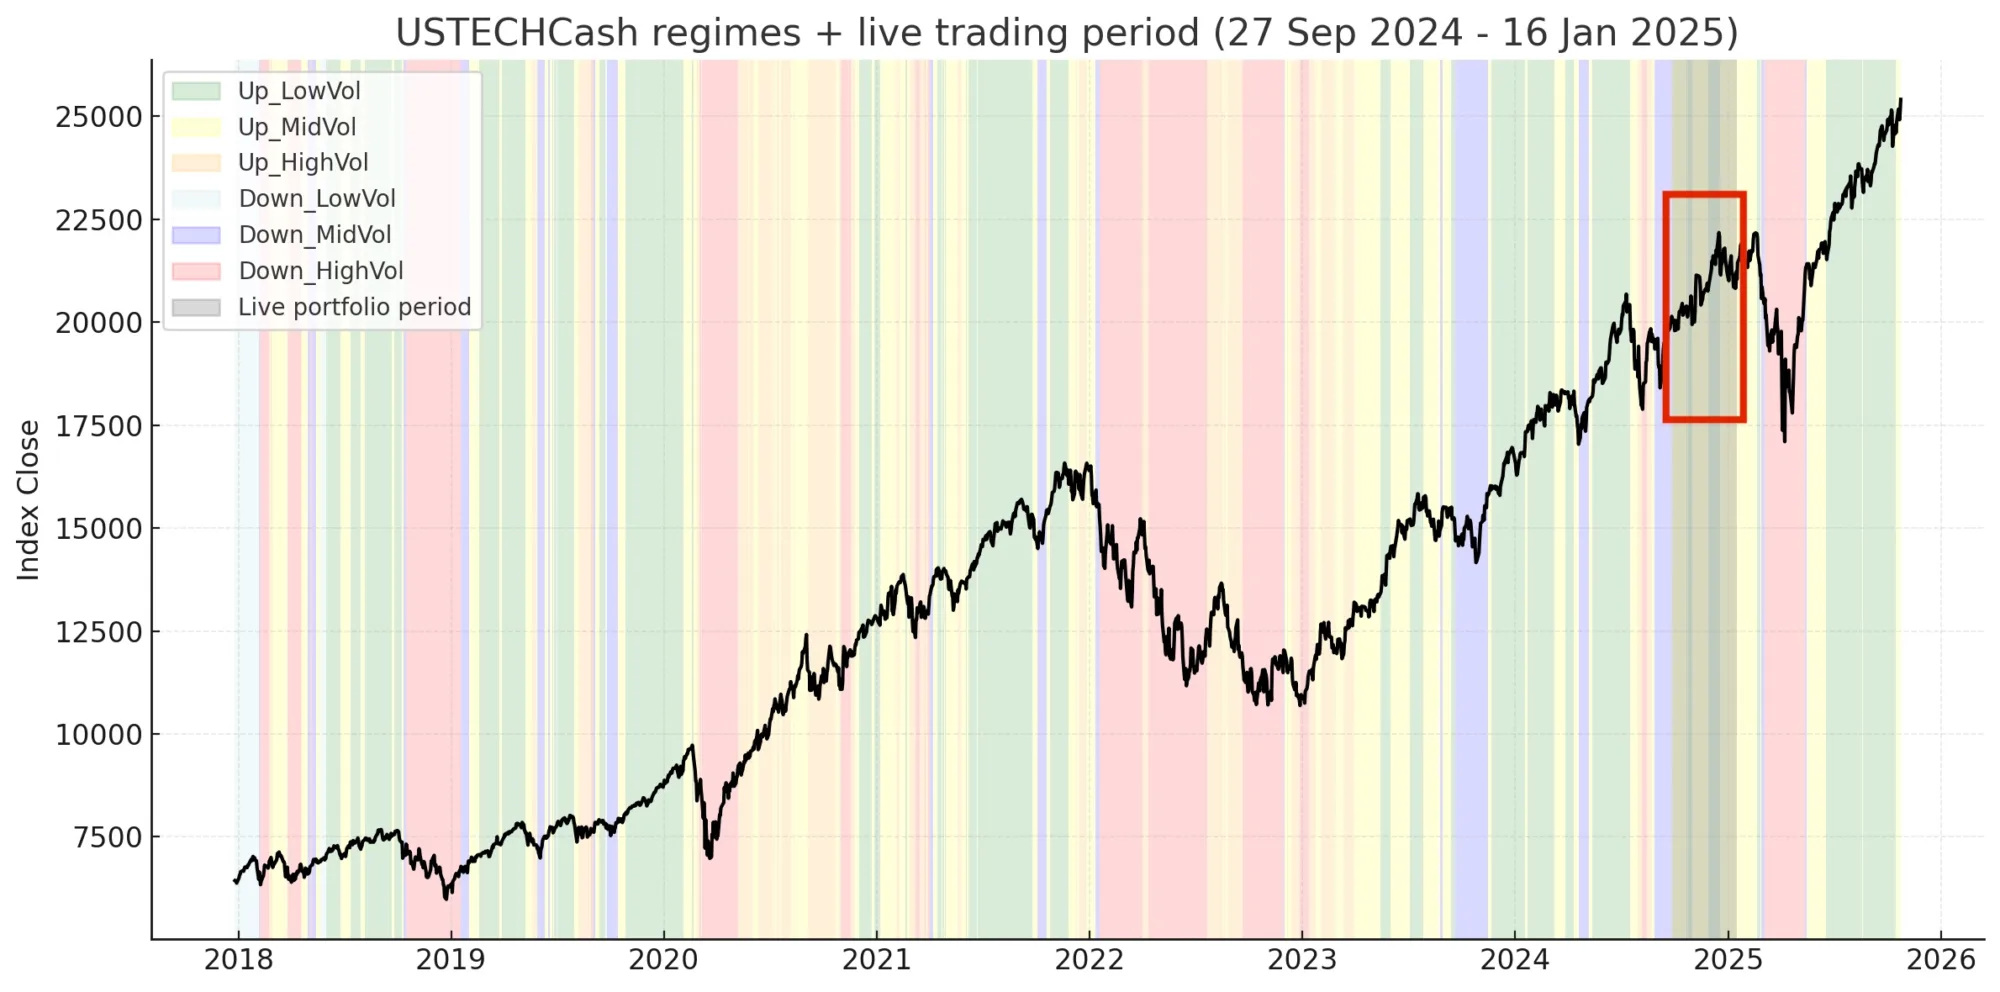
The full verified record is publicly available on FXBlue:
👉 https://www.fxblue.com/users/lukasmelka1
This result perfectly illustrates how understanding market regimes can turn an average algorithm into a consistent performer — not through curve-fitting, but through correct timing and adaptive exposure management.
Market-regime filter FAQ
What is a market-regime filter?
A market-regime filter is a rule that only allows a strategy to trade when the market is in a favourable state, and disables it otherwise. QuantMonitor’s version enables trading only when the 50-period SMA is rising and ATR-based volatility is below its 100-period average.
How do I add a regime filter to a StrategyQuant strategy?
Add SMA(50) and ATR(14) indicators to your strategy in StrategyQuant X, build the trend condition SMA(50)[0] > SMA(50)[5] and the volatility condition ATR% < MA(ATR%, 100) (where ATR% = ATR(14)/Close), then combine them with AND on your entry signal. Wrapping the rule in a Custom Block lets you reuse the same 1/0 filter across strategies.
What SMA and ATR values should I use for a regime filter?
The QuantMonitor baseline is SMA period 50 with a 5-bar slope lookback for the trend, and ATR period 14 compared against a 100-bar average of ATR% for volatility. Treat these as reasonable starting defaults and re-test on your own instrument and timeframe before changing them.
Does a regime filter improve backtest results?
It can, by keeping a strategy out of the conditions where it historically loses. In the named-regime backtest on this page the filter stays active almost entirely in the calm up-trend (Up_LowVol) and is switched fully off across every down-trend regime, concentrating exposure where the edge lives. See more worked examples in the free strategy portfolio on our blog.
Can I reuse the same regime filter across different markets?
Yes — because the rule is expressed in relative terms (ATR% divided by price, and a moving average of itself) it is unit-free and transfers across instruments without rescaling. Always re-run the backtest on each new market, since the same regimes appear at different frequencies in equities, futures and FX.
Related reading
- How to Algorithmically Detect Market Regimes — the full methodology for classifying trend and volatility states.
- Trial StrategyQuant: use the algorithmic trading software for free — set up the platform before you build the filter.
- Free trading strategies (blog portfolio) — worked examples that apply regime filtering across markets.