Turning Market “Weather” Into a Systematic Input for Risk, Allocation, and Adaptation
Introduction: Regimes Are Not Predictions
Regime detection is often misunderstood as a way to forecast what the market will do next. That framing leads to fragile models, over-optimized filters, and the illusion of control.
Modern regime detection is better understood as classification, not prediction.
- A forecast claims: “Price will rise.”
- A regime model claims: “The environment currently resembles conditions under which certain behaviors tend to appear.”
That distinction matters because markets are not stationary. They are changing systems shaped by shifting participation, volatility, liquidity constraints, and collective behavior. Strategies rarely stop working because their “logic is wrong.” They stop working because the environment changes and the logic no longer matches it.
A regime model does not need to be “right” in a directional sense to be valuable. Its purpose is to reduce the probability of trading a system outside the conditions it was built to exploit, and to provide a consistent way to throttle risk when uncertainty rises.
If robust strategy design answers “Can this system survive?” and system health answers “Is it still valid?”, regime detection answers “What kind of market is this right now—and what does that imply for exposure?”
1. What Is a Market Regime?
A regime is a persistent market state defined by the behavior of key structural variables—not by a single indicator reading.
Regimes are not defined by price alone. Price is the surface. Regimes are the underlying constraints that shape how price can move.
At the practical level, regimes are about whether the market is currently dominated by:
- Directionality vs mean reversion
- Volatility compression vs expansion
- Liquidity continuity vs discontinuity
- Stable correlations vs correlation breakdown
A useful regime definition must satisfy three criteria:
- Observable: it can be inferred from data without storytelling.
- Persistent: it lasts long enough to matter for decisions.
- Actionable: it implies different risk or execution behaviors.
If a regime definition is not actionable, it becomes a taxonomy hobby. In systematic trading, every label must justify its existence by changing what you do.
2. The Three-Layer Regime Model
Most regime systems fail because they try to compress the market into one label, one number, or one on/off switch.
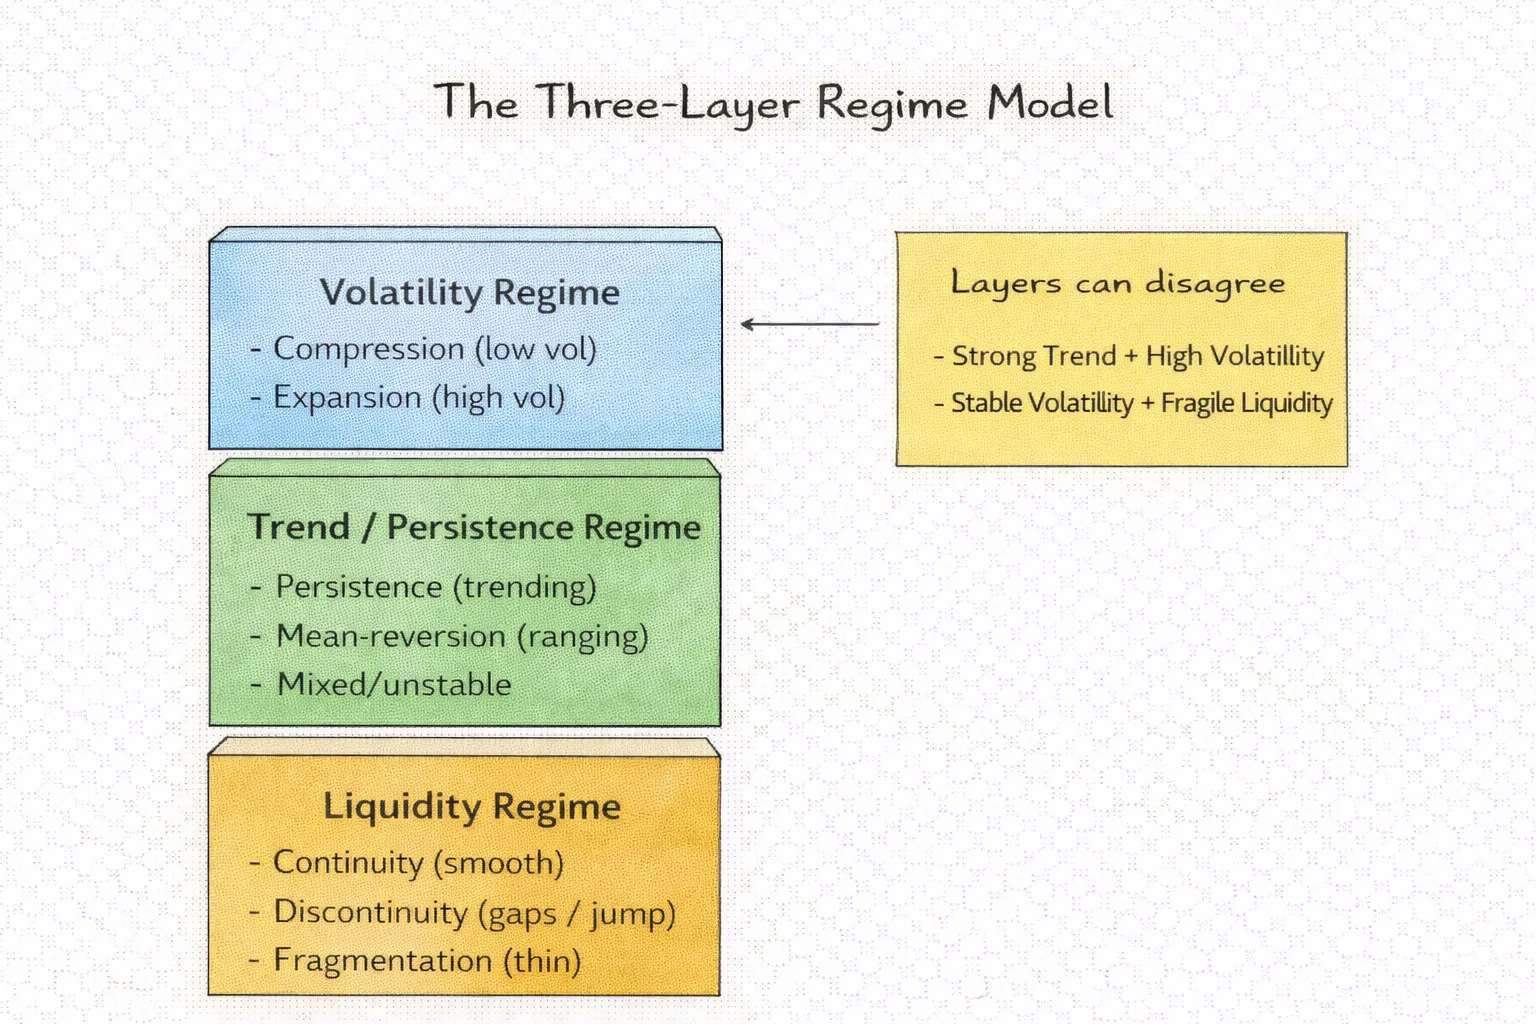
In reality, regimes exist in layers. The most useful approach is to treat regime detection as a stack of independent classifications:
Layer A: Volatility Regime
The market’s range behavior.
- Compression (range contraction, low realized volatility)
- Expansion (range growth, volatility spikes)
- Volatility-of-volatility (stability vs instability of volatility itself)
Volatility regime influences:
- stop placement viability
- position sizing stability
- tail risk frequency
- breakout reliability
Layer B: Trend / Persistence Regime
The market’s tendency to continue or revert.
- Persistence (trend-following environments)
- Mean-reversion (range-bound environments)
- Mixed/unstable (frequent reversals, regime churn)
Trend regime influences:
- whether trend systems have edge
- whether pullbacks are entries or traps
- whether breakouts sustain or fail
Layer C: Liquidity / Continuity Regime
The market’s microstructure “smoothness.”
- Continuity (few gaps, stable order flow)
- Discontinuity (gaps, slippage, jump risk)
- Fragmentation (thin depth, rapid impact)
Liquidity regime influences:
- execution risk
- slippage distribution
- gap exposure
- whether historical fills are representative
Key insight: These layers can disagree.
You can have:
- strong trend + high volatility
- low volatility + mean reversion
- stable volatility + fragile liquidity
- trending price with discontinuous execution risk
A single regime label cannot capture this. A layered model can.
3. The Binary Fallacy: Why “Risk-On/Risk-Off” Is Not Enough
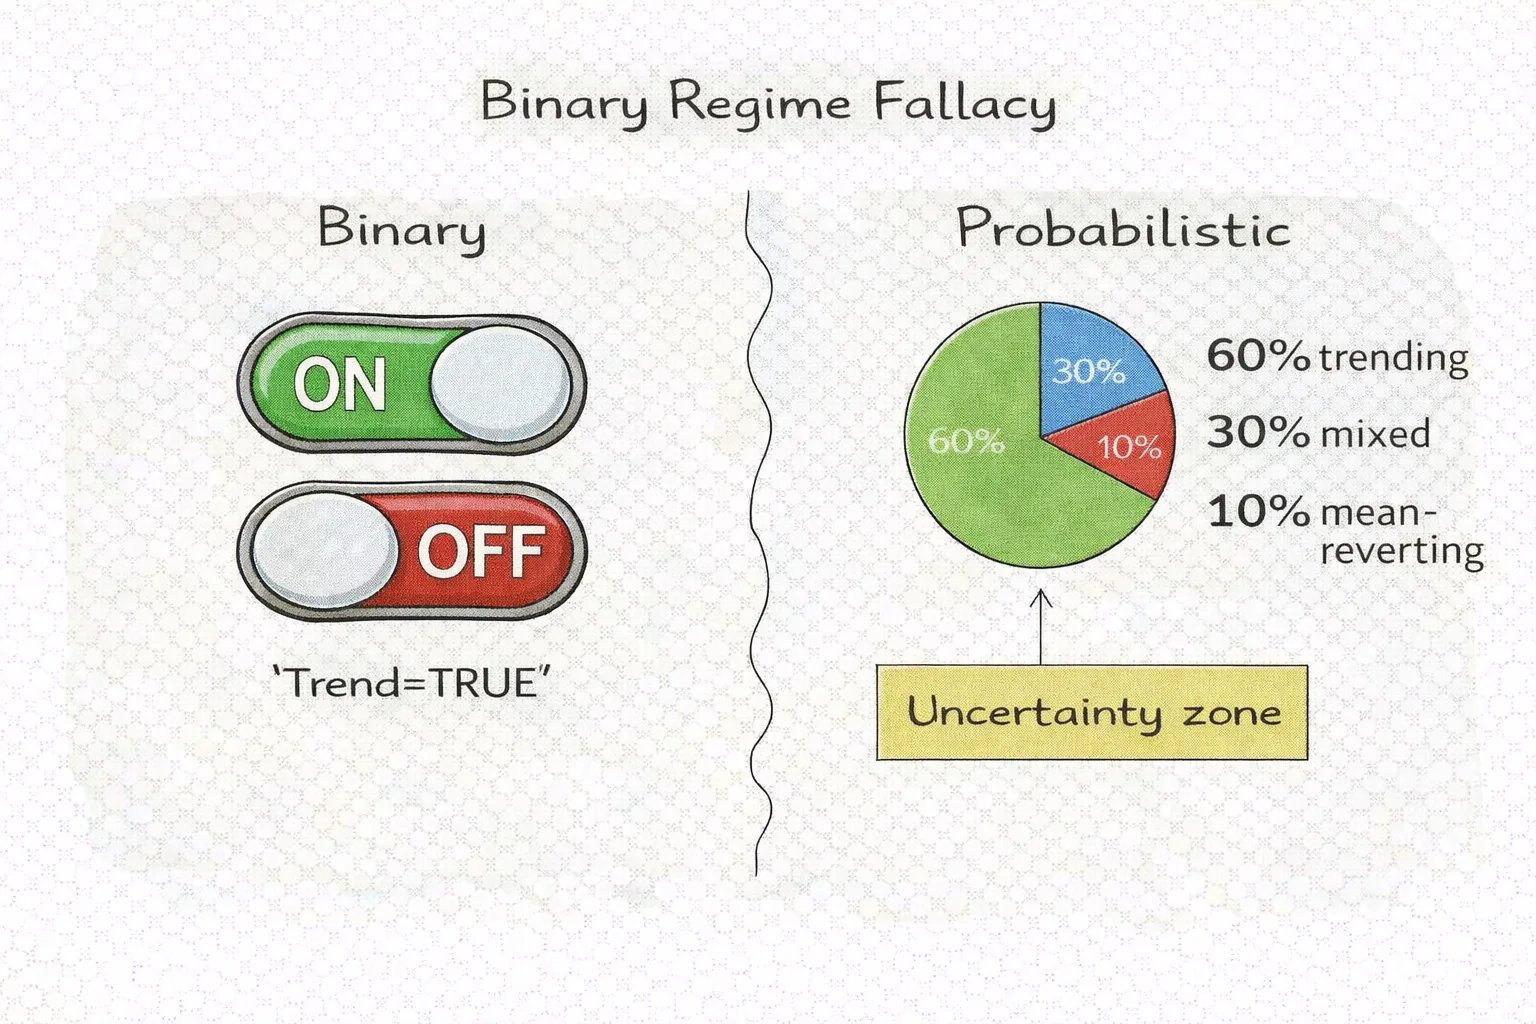
Binary regimes are comforting, simple, and usually wrong.
A model that flips between two states is forced to commit too strongly to noisy information. Markets transition gradually, not as clean switches. The cost of hard switching is usually paid in churn, whipsaw, and false confidence.
Modern regime detection should be framed as:
- probability distribution over states
- not a single state label
The practical output should look like:
- 60% trending
- 30% mixed
- 10% mean-reverting
instead of:
- “trending = true”
This enables risk throttling rather than absolute gating.
4. What Regime Detection Is For
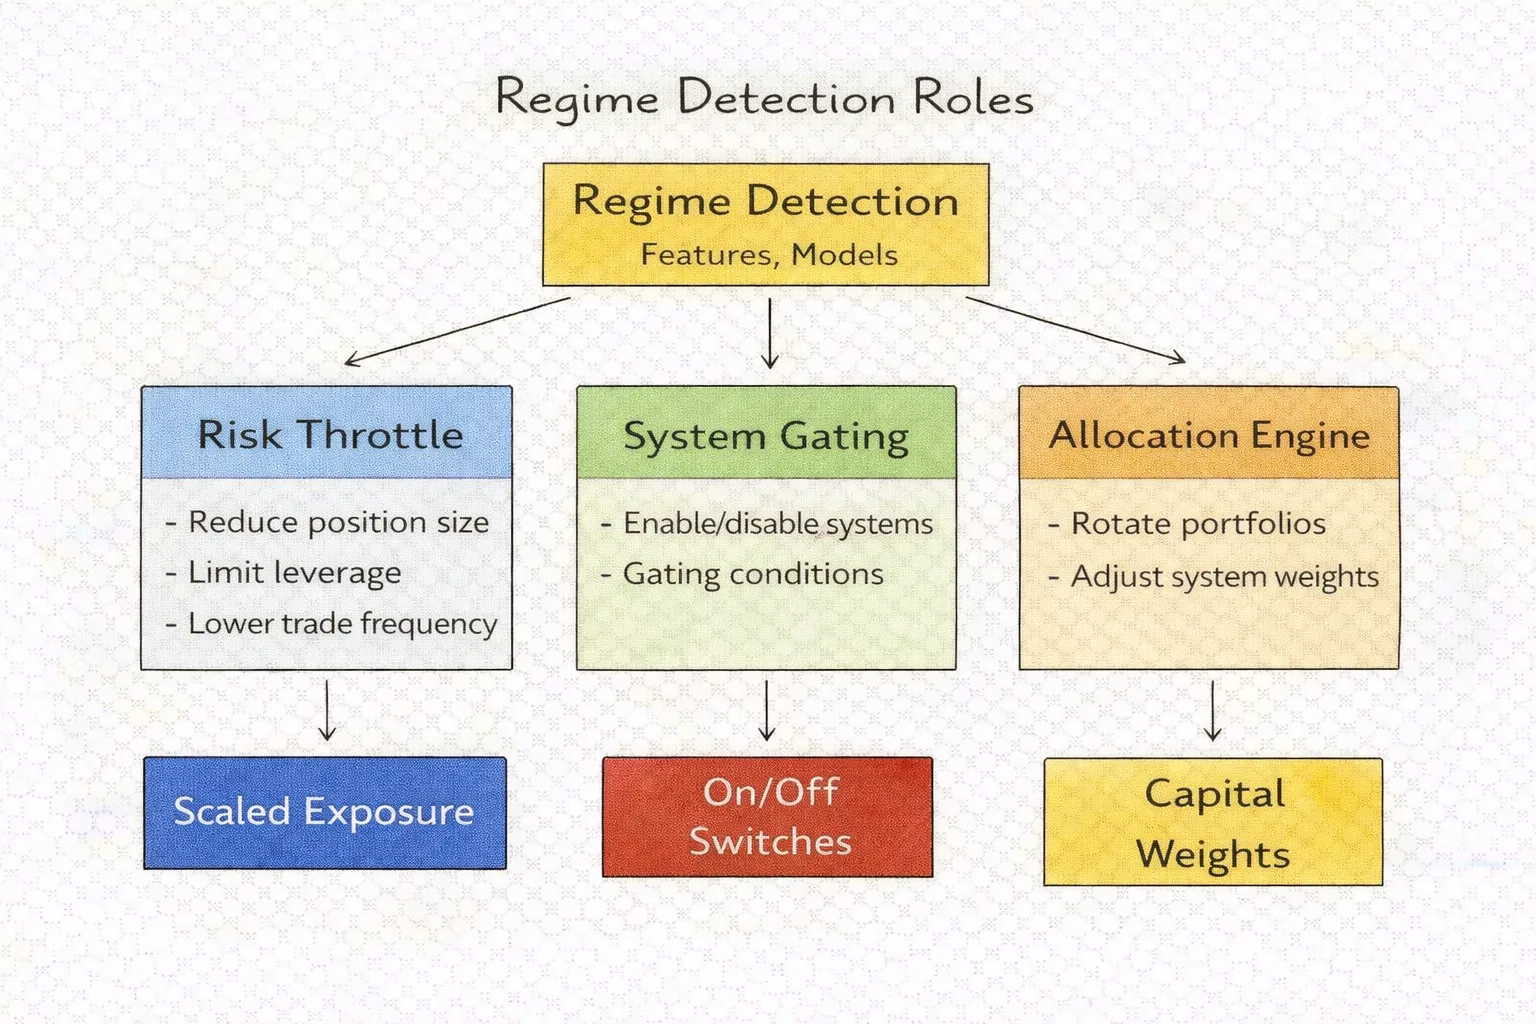
To avoid building fragile systems, define the purpose of regime detection clearly. There are three legitimate roles.
Role 1: Risk Throttle
Regime detection reduces exposure when the environment becomes unfavorable or uncertain.
- reduce size
- widen stops or reduce trades
- lower leverage
- limit trade frequency
This is the safest use case. It does not need perfect classification; it only needs to identify danger zones reliably.
Role 2: System Gating
Certain strategies should only run in specific conditions. Regime detection acts like a switch.
- trend strategies enabled when persistence is high
- mean reversion enabled when volatility is stable and ranges hold
- breakout strategies enabled after compression
Gating is powerful but dangerous if the classifier overfits. When gating is wrong, it removes trades that would have worked and admits trades that should not exist.
Role 3: Allocation Engine
For portfolios, regime detection becomes capital rotation.
- allocate more to trend systems when trend probability rises
- allocate more to defensive/short-vol systems when volatility expansion dominates
- reduce exposure across all systems when liquidity regime turns discontinuous
This is the most sophisticated use. It is also the most fragile if not managed conservatively.
5. Feature Engineering: What You Measure Becomes Your Reality
Regime detection is not primarily a modeling problem. It is a measurement problem.
Your regime model is only as good as the features that represent the environment. Good regime features are:
- robust across time
- stable under small data changes
- less sensitive to noise
- interpretable enough to debug
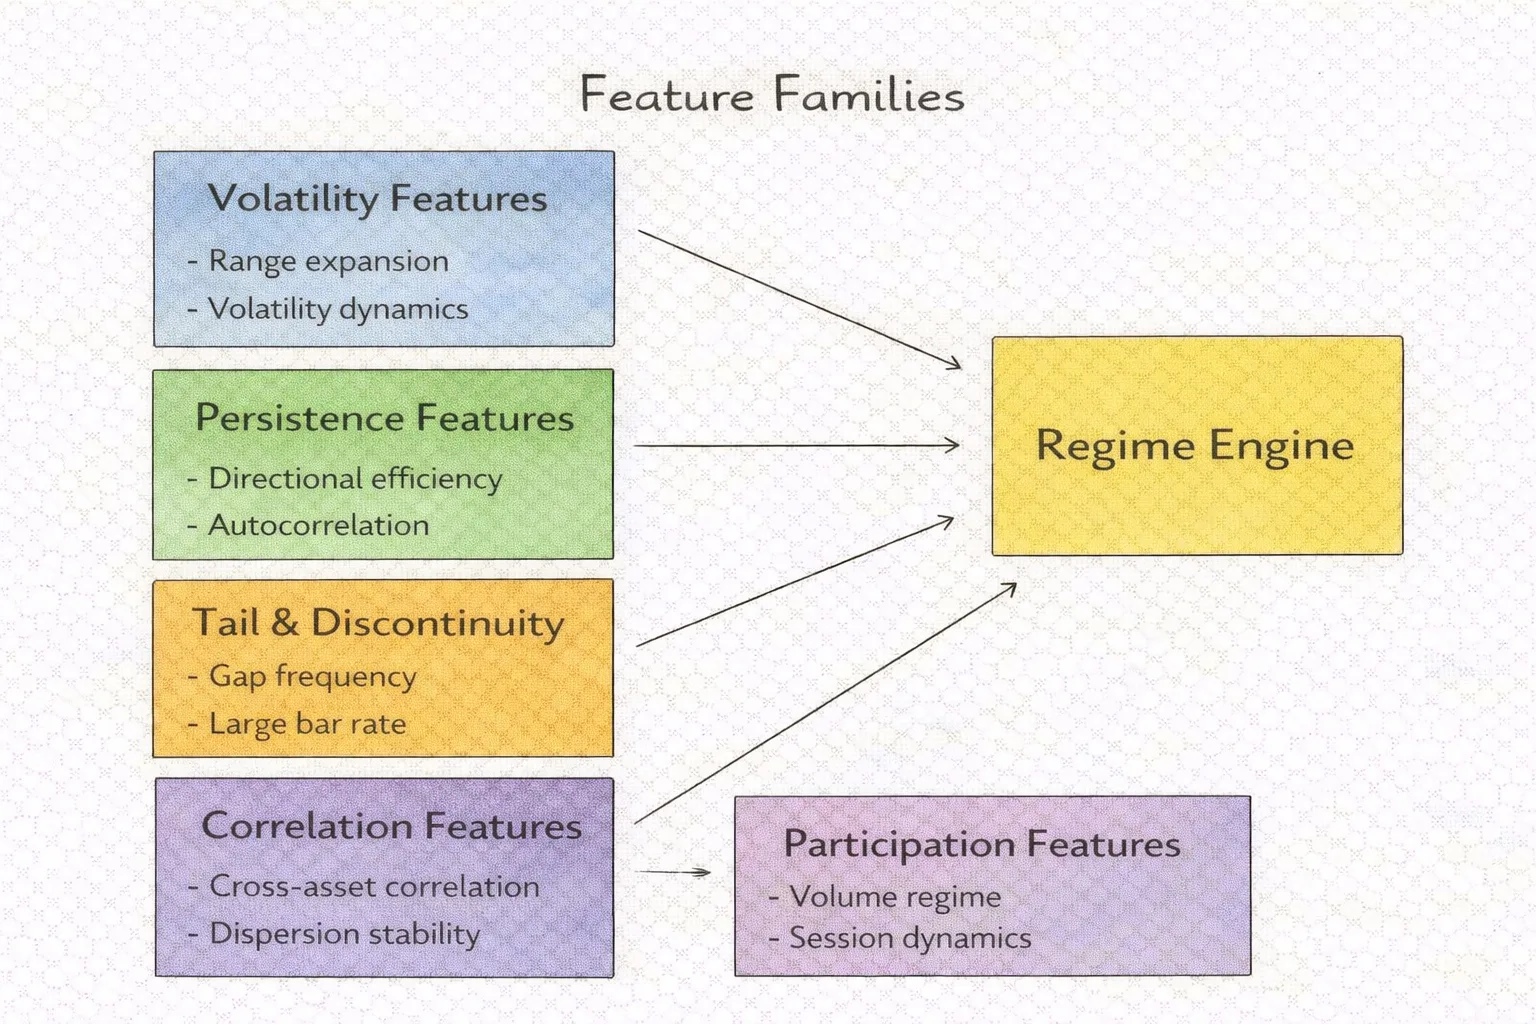
Below are feature families that consistently matter in practical regime systems.
A. Volatility Structure Features
- realized volatility (rolling)
- ATR dynamics
- range expansion rate
- volatility-of-volatility (stability of vol)
Interpretation:
- compression tends to precede breakouts
- expansion increases stop-outs and tail risk
B. Directional Efficiency / Persistence Features
- directional efficiency ratio (net movement / total movement)
- autocorrelation proxies
- slope consistency measures
- trend strength as persistence, not magnitude
Interpretation:
- persistence regimes reward trend logic
- choppy regimes punish lagging systems
C. Tail & Discontinuity Features
- gap frequency
- large bar frequency (relative to ATR)
- jump risk proxies
- slippage distribution shifts (if available)
Interpretation:
- tail regimes break naive risk models
D. Correlation & Cross-Asset Features
- rolling correlations among major assets
- correlation spikes and breakdowns
- dispersion measures
Interpretation:
- correlation increases during stress
- diversification fails when regimes shift
E. Participation / Flow Proxies (when available)
- volume regime classification
- volume imbalance proxies
- session-based activity changes
Interpretation:
- participation shifts can rewire price behavior even if volatility looks stable
The more your features rely on fragile constructs, the more regime detection becomes a hallucination machine.
6. Regime Models: From Simple to Modern
The regime model you choose should match your use case. The most common failure is choosing a complex model to solve a simple gating problem, then overfitting the classifier to the past.
Model Class A: Rule-Based Regime Filters
The classic approach.
Examples:
- volatility filter: trade only when ATR within band
- trend filter: trade only when persistence > threshold
- compression filter: breakout only after contraction
Strengths:
- interpretable
- stable
- easy to debug
- low overfitting risk
Weaknesses:
- limited nuance
- struggles with mixed regimes
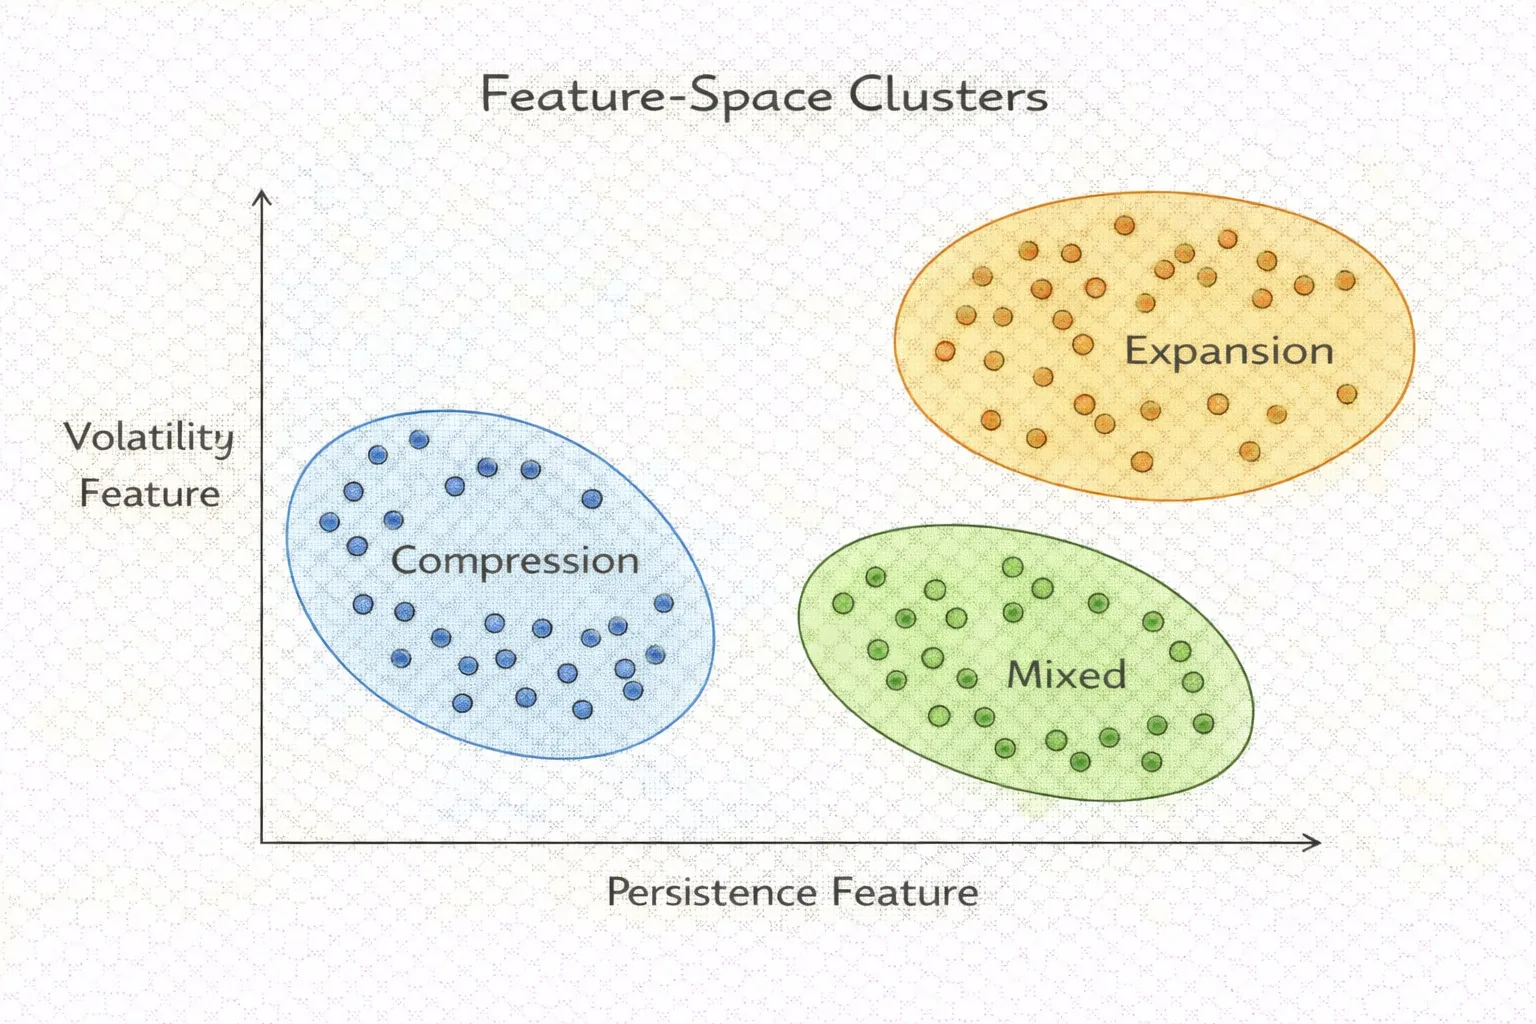
Model Class B: Clustering (K-means / GMM)
Unsupervised grouping of feature space.
Strengths:
- does not require labels
- reveals natural groups
- can produce soft probabilities (GMM)
Weaknesses:
- clusters may not map to meaningful regimes
- sensitive to scaling and feature selection
Best use:
- discovery tool
- building a regime vocabulary
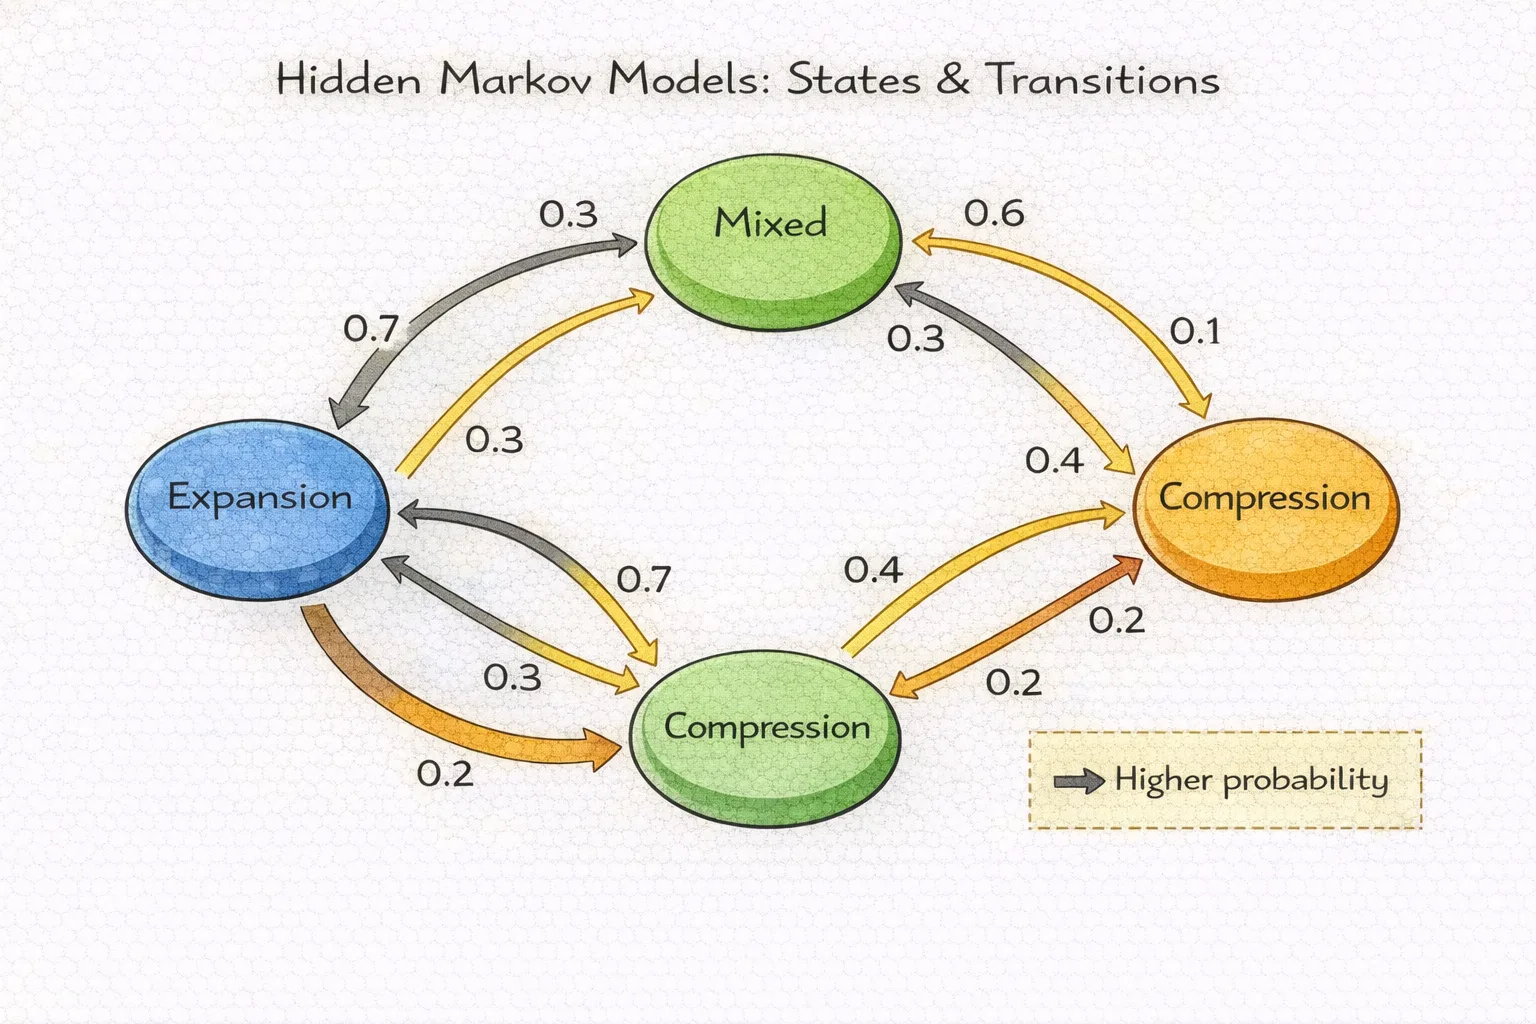
Model Class C: Hidden Markov Models (HMM)
A state model with transition probabilities.
Strengths:
- models persistence and transitions explicitly
- natural probabilistic output
- captures “sticky” regimes
Weaknesses:
- assumptions can be violated (Gaussian emissions)
- can misclassify during transitions
- may lag changes
Best use:
- medium-term regime inference where transitions matter
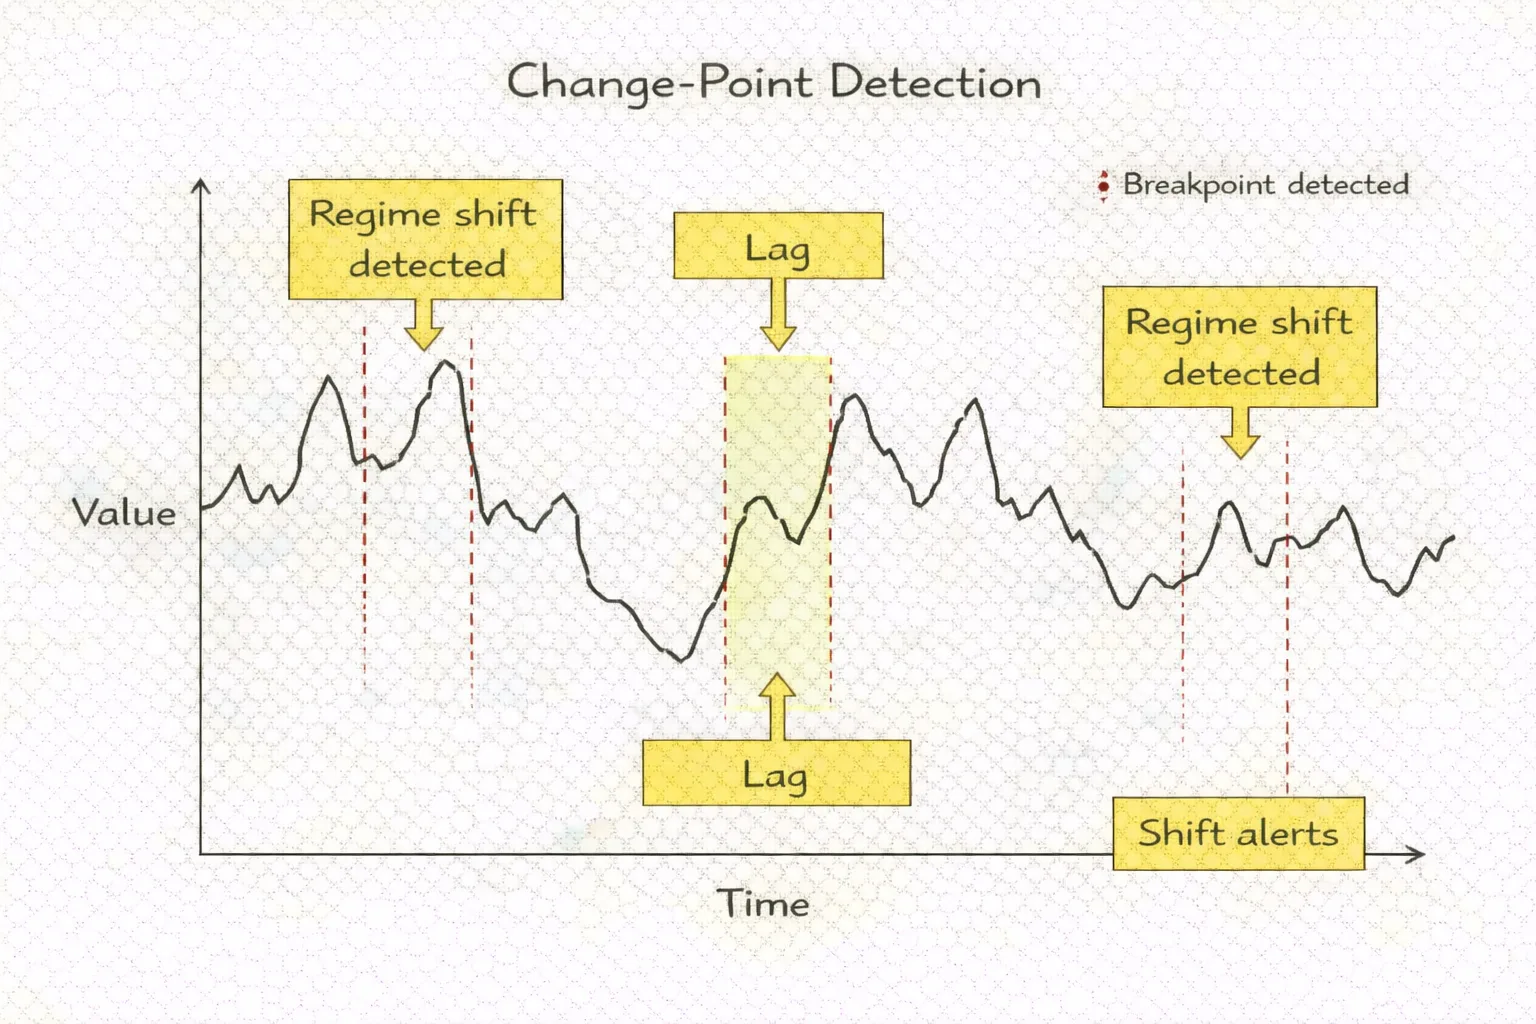
Model Class D: Bayesian Change-Point Detection
Focuses on detecting breaks rather than labeling stable states.
Strengths:
- excellent for regime shift alerts
- does not pretend regimes are stable categories
- aligns with “health monitoring”
Weaknesses:
- may over-trigger if not constrained
- produces signals, not stable regimes
Best use:
- early warning layer
- kill-switch / risk-off triggers
Model Class E: Modern ML Classifiers (RF / XGBoost / shallow nets)
Supervised models mapping features to regime labels.
Strengths:
- strong mapping capacity
- handles nonlinear boundaries
- can integrate many feature families
Weaknesses:
- labeling is hard (see next section)
- prone to overfitting
- can be fragile under regime novelty
Best use:
- only when labels are credible and validation is strict
A general rule: start simple.
Complex models are rarely necessary to achieve most of the benefit of regime detection.
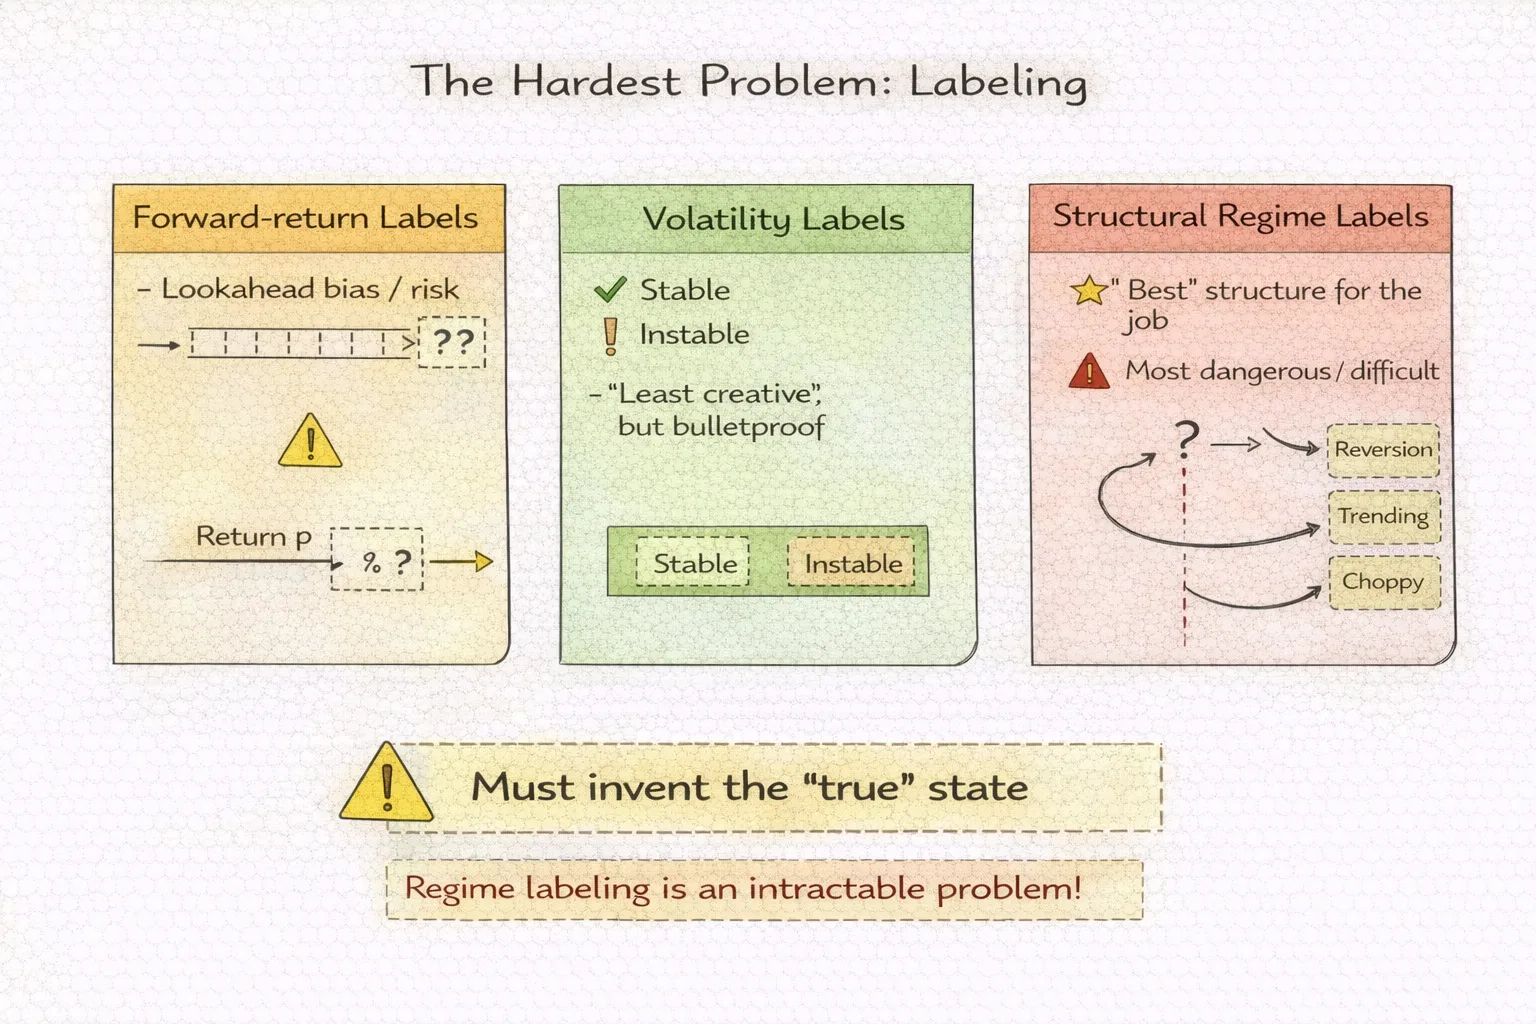
7. The Hardest Problem: Labeling
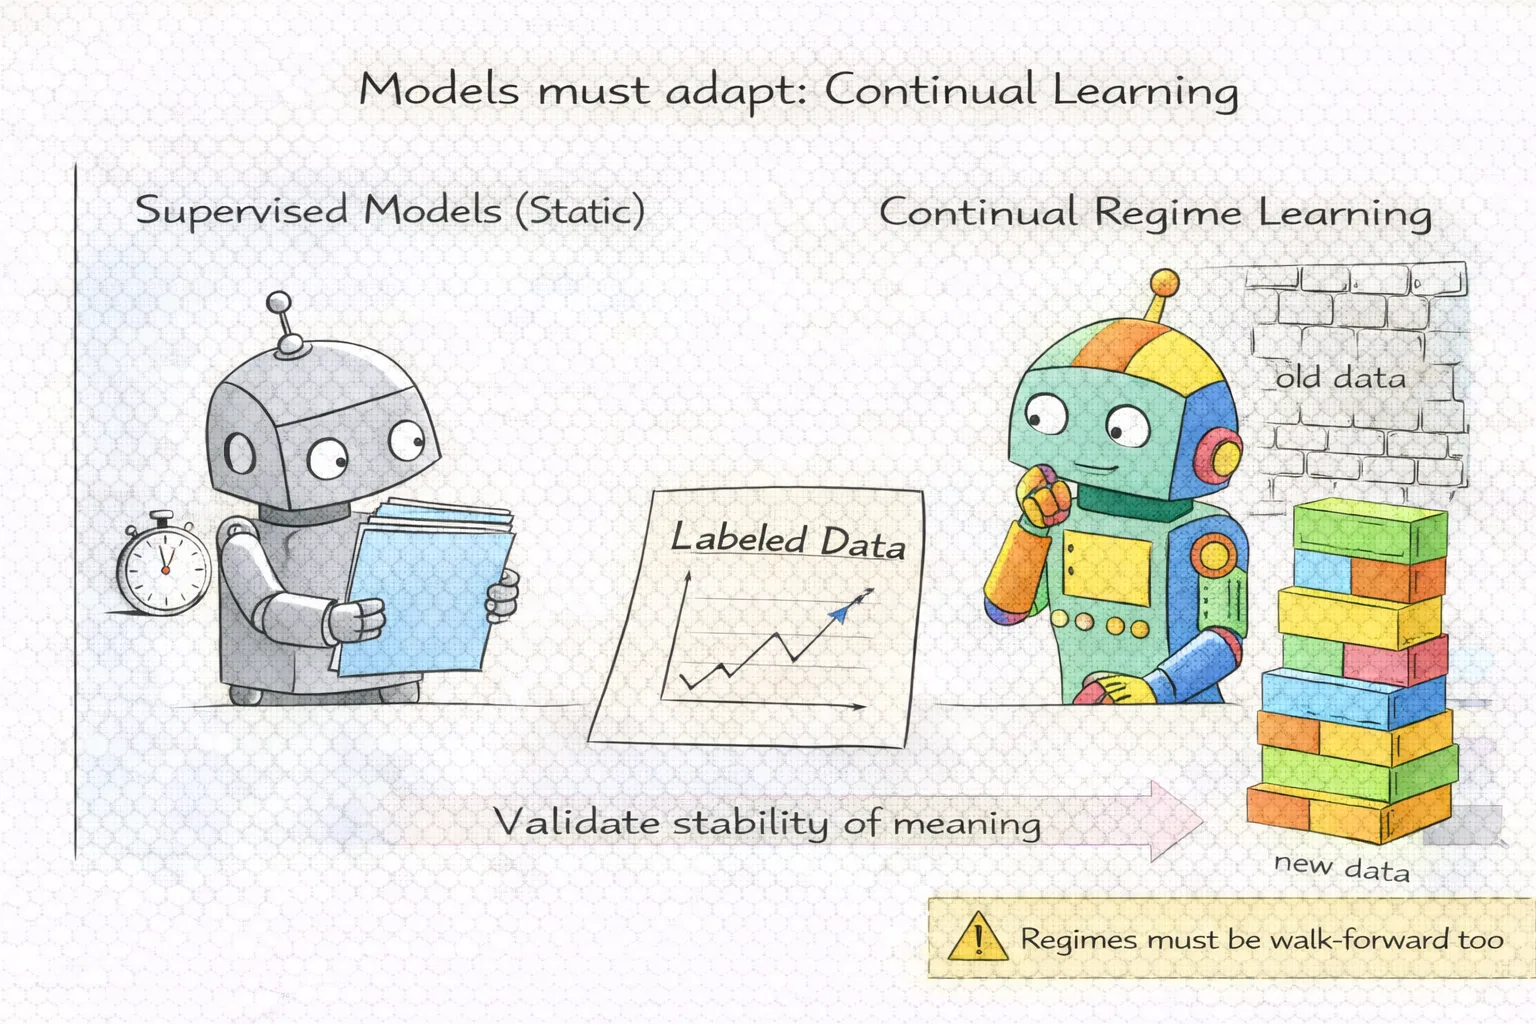
If you use supervised learning, you need labels. Labels create the illusion of truth, but market regimes do not come with ground truth tags.
Common labeling methods:
A. Forward Return Labels (dangerous)
Label the regime by what happens next.
Example:
- “trend regime” if next 20 bars return is positive and large
- “mean reversion regime” if next return is near zero
Problem:
- lookahead bias is easy to hide
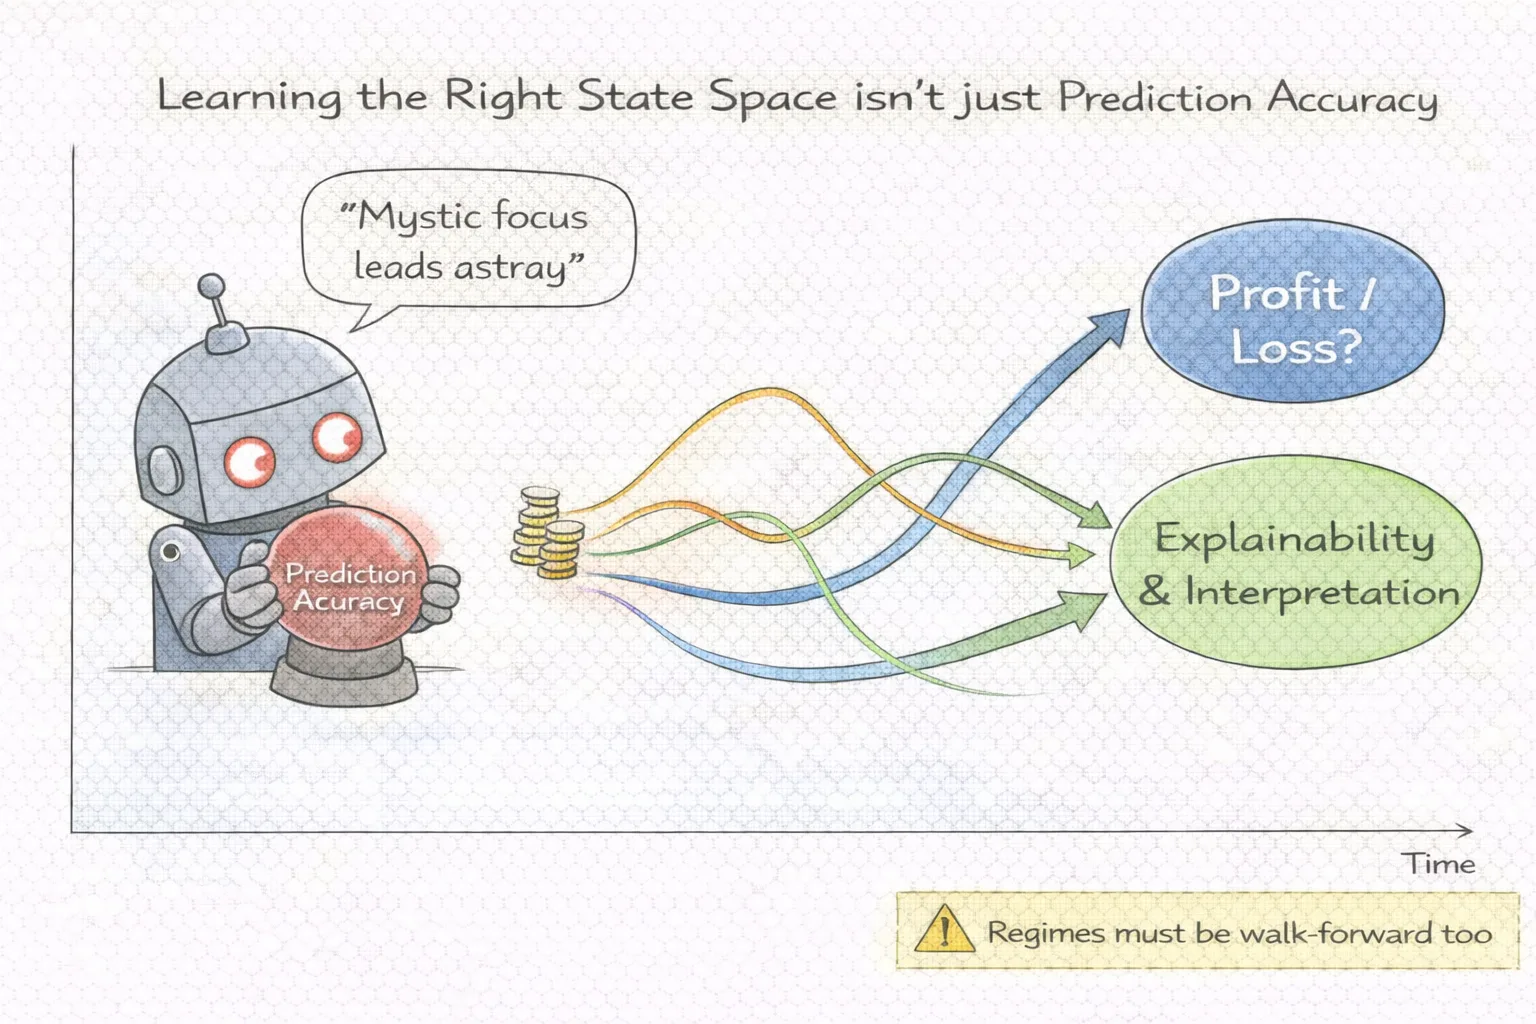
- labels become outcome-defined, not environment-defined
- the classifier learns to predict returns rather than detect regimes
B. Volatility-Based Labels (more stable)
Define regimes by volatility levels and transitions.
Example:
- low vol, medium vol, high vol states
This is often stable and useful, but limited: it ignores directionality and liquidity.
C. Structural Labels (best but hardest)
Define regimes by structural descriptors:
- persistence metrics
- range stability
- tail frequency
- correlation behavior
This method produces the most honest regime models because labels represent the environment rather than the outcome.
But it requires careful design. Poor structural labels create a model that predicts your own flawed definitions.
The best labeling approach is often hybrid:
- use unsupervised clustering to discover structure
- interpret clusters into structural regimes
- validate behavior consistency across time
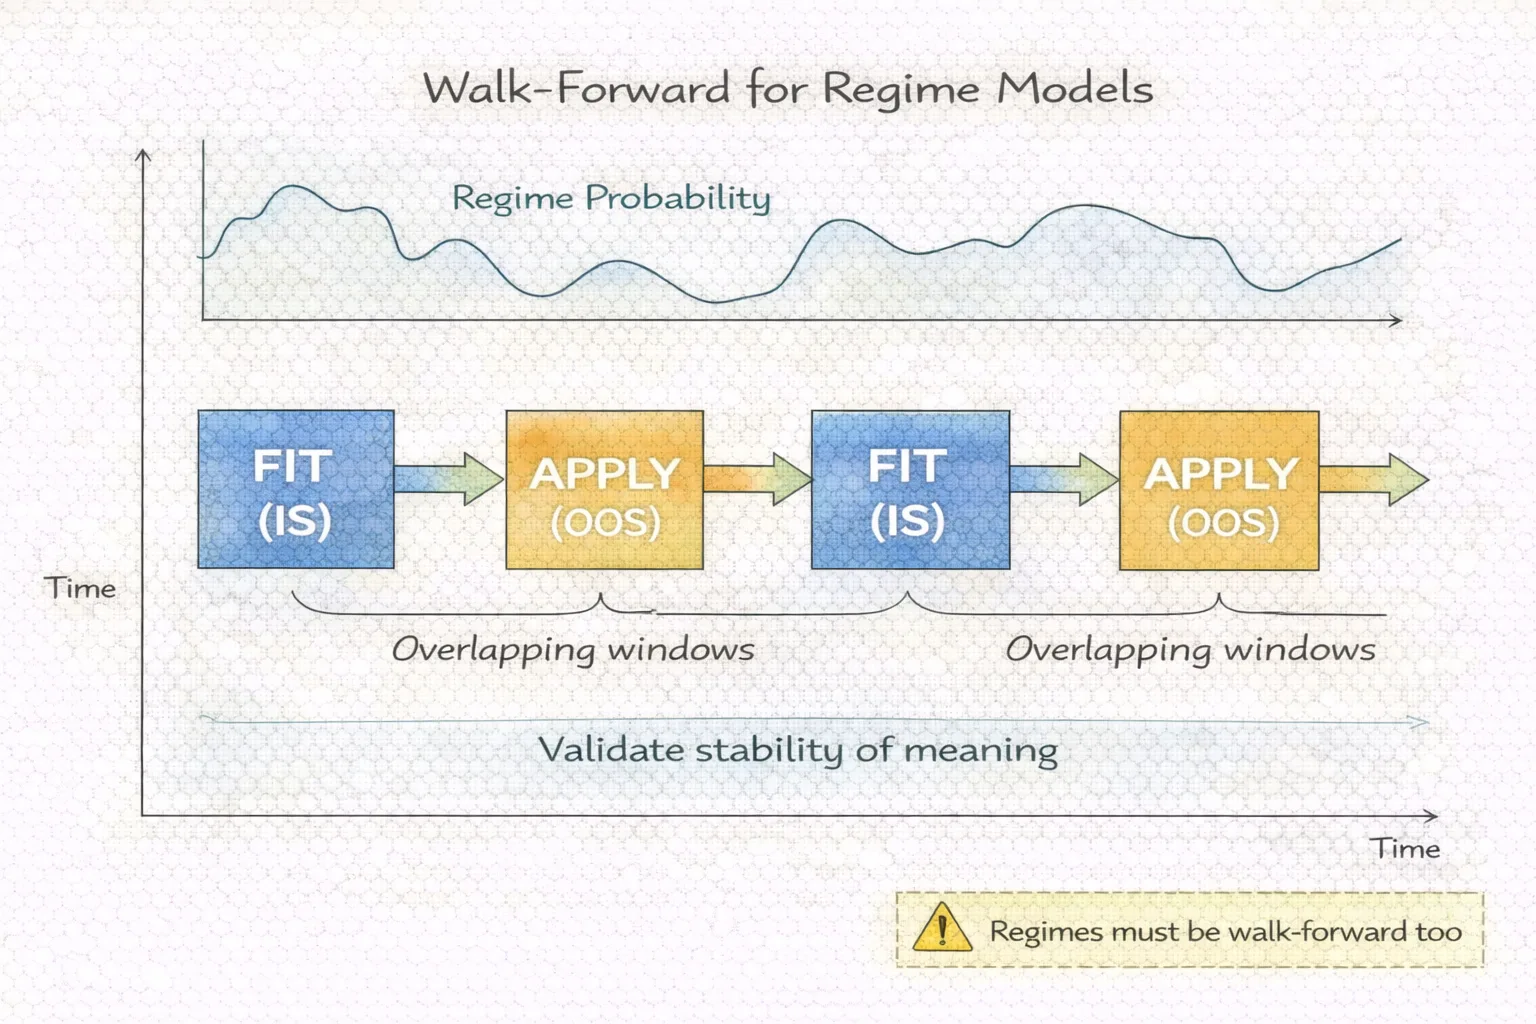
8. Validation: Regime Models Must Be Walk-Forward Too
The moment a regime model uses historical data to define states, it becomes subject to the same risk as any trading system: it may fit the past too well.
Regime detection must be validated through:
- rolling windows
- forward application
- stability analysis
What to test
- state persistence: are regimes sticky or churning?
- transition stability: do transition probabilities hold?
- out-of-sample consistency: do regimes mean the same thing later?
- decision impact: does regime gating reduce risk without destroying edge?
A regime model that classifies well but provides no stable decision advantage is not a regime model—it is a data decoration.
9. Regime Overfitting: The Quiet Failure Mode
Regime overfitting occurs when the regime classifier becomes too reactive or too specific.
Symptoms:
- too many regime flips
- strong performance improvement in backtests but worse live results
- frequent “almost right” classifications
- gating that suppresses edge more than it suppresses risk
The fix is usually not more complexity.
It is constraints:
- require minimum regime duration
- use probabilities, not hard switches
- throttle risk rather than block trading entirely
- reduce feature count
- favor robustness over sensitivity
A good regime model is not the one that detects every change.
It is the one that avoids the worst environments reliably.
10. Regime Detection as a Risk System
The safest deployment pattern is:
- Detect regime probabilities
- Compute uncertainty index
- Adjust exposure
Instead of:
- trade vs don’t trade
Think:
- full size vs reduced size vs pause
A practical risk throttle might work like:
- if uncertainty high → reduce size
- if volatility expansion → cap leverage
- if liquidity discontinuity → disable high-frequency entries
- if persistence low → reduce trend-following exposure
This makes regime detection a safety system, not a performance enhancer. That’s how you keep it robust.
11. Portfolio Regimes: Correlation Is the Real Enemy
Portfolio failures rarely occur because one system breaks. They occur because systems become correlated precisely when you need them not to.
Correlation regimes matter:
- stable correlations during calm
- correlation spikes during stress
- correlation breakdown after shock
A modern regime model for portfolios should track:
- correlation magnitude
- correlation stability
- dispersion measures
- volatility expansion
This enables portfolio-level actions:
- reduce total exposure
- rotate to defensive systems
- increase cash allocation
- reduce correlated clusters
In other words: regime detection becomes portfolio health management.
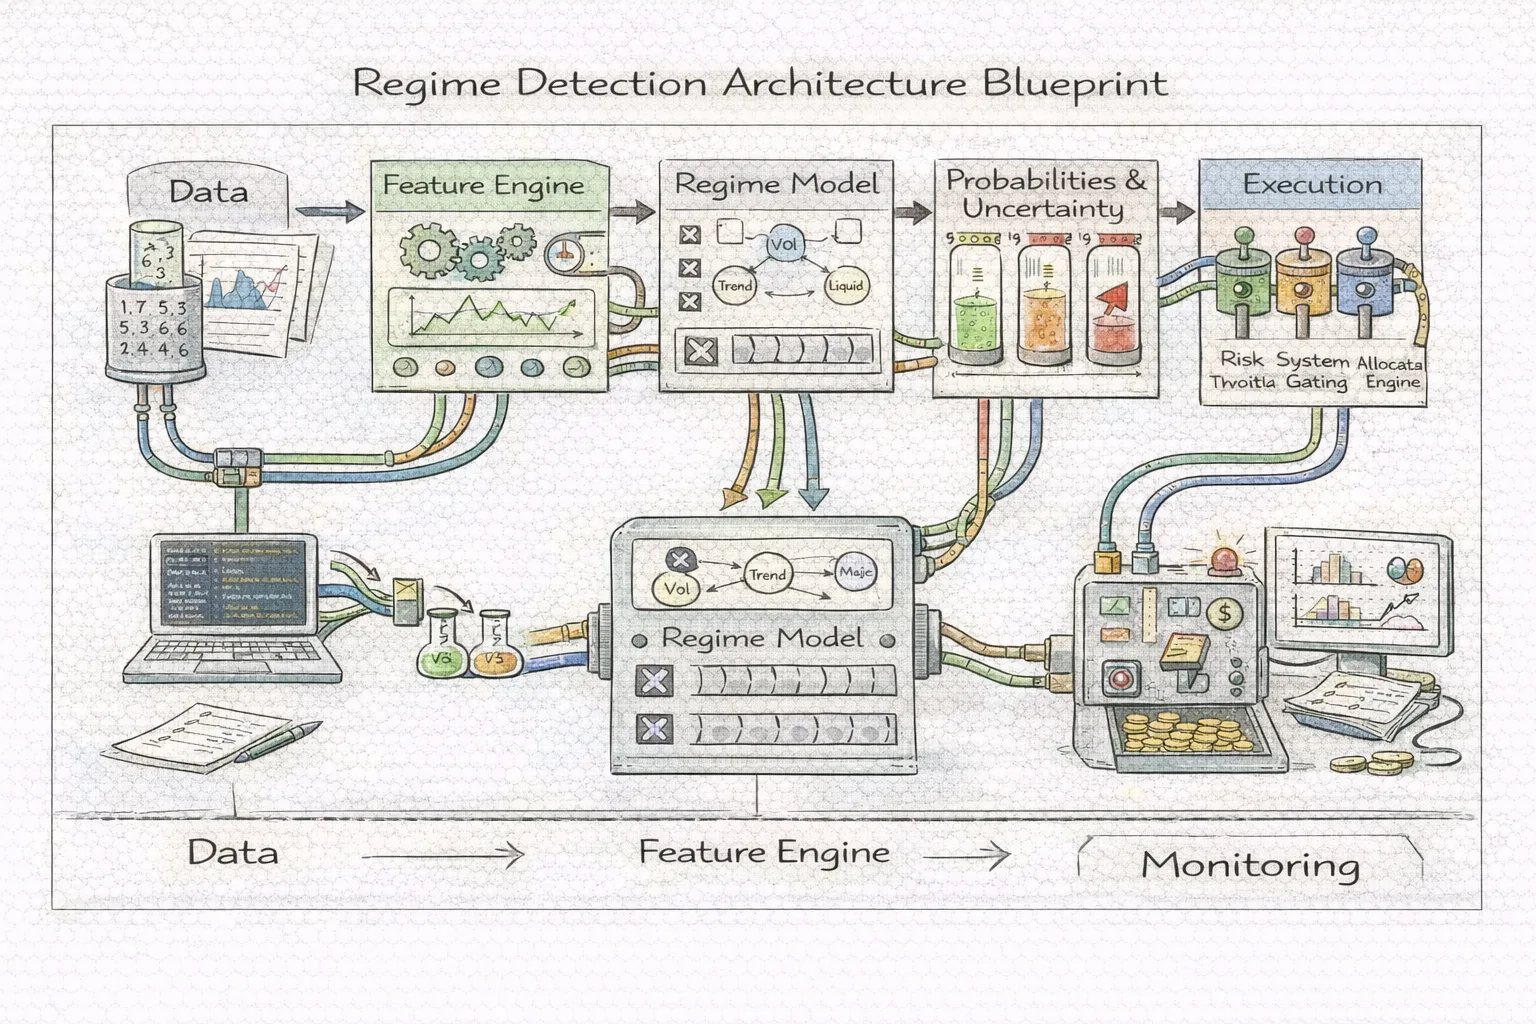
12. Implementation Blueprint: A Practical Architecture
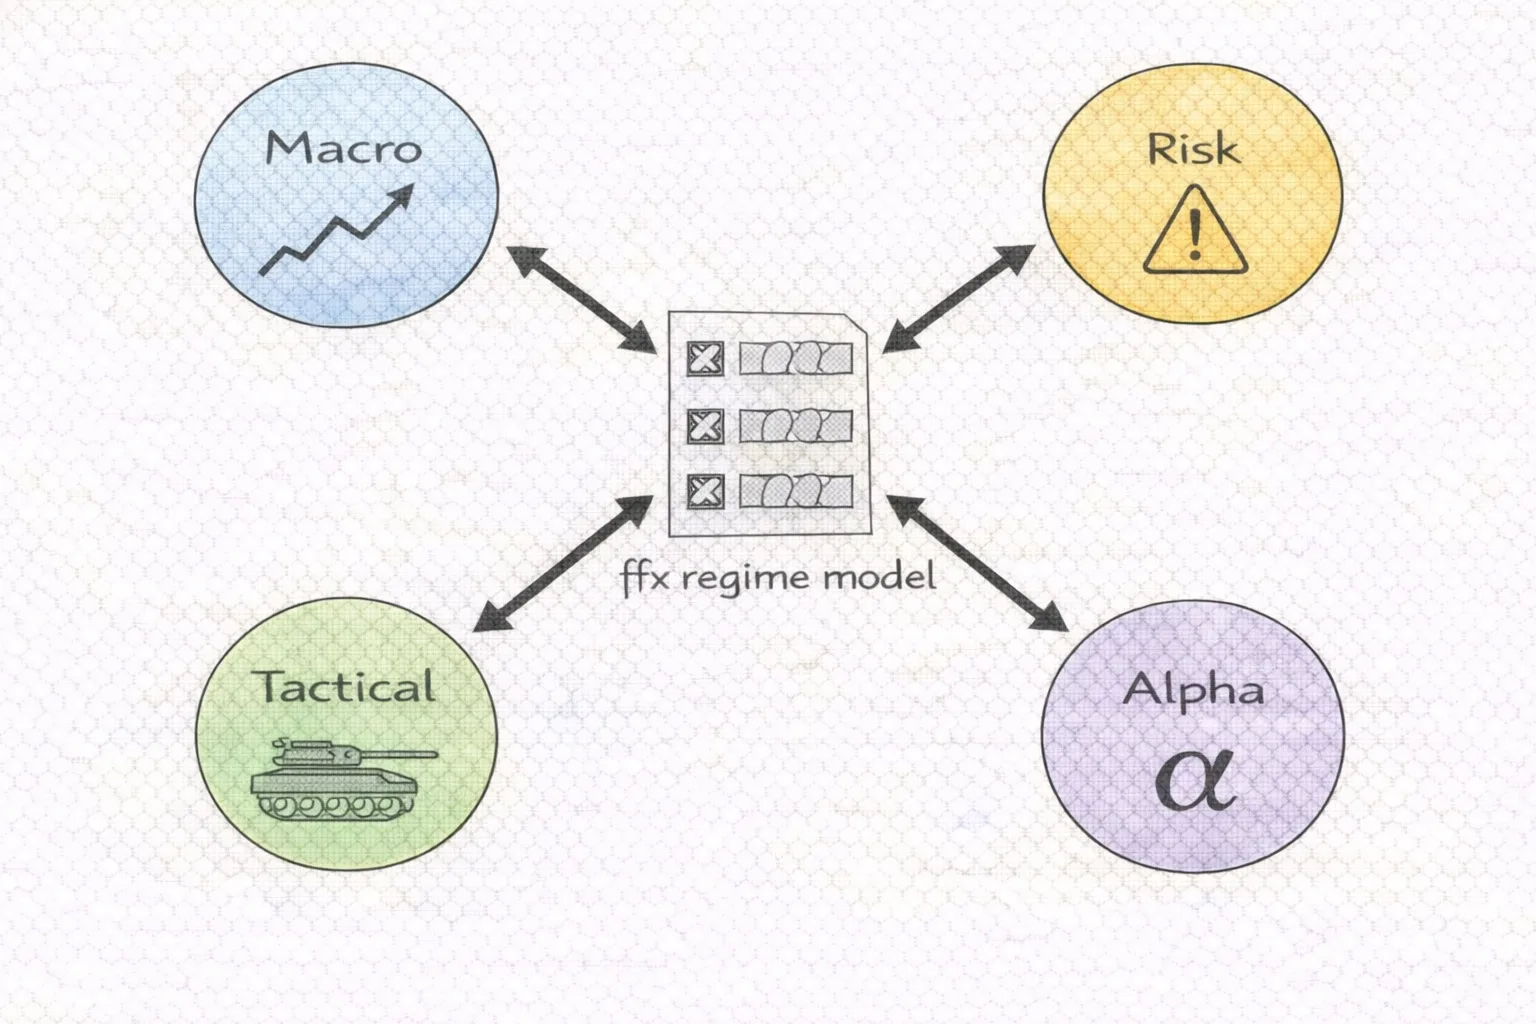
A robust implementation separates three components.
A. Regime Engine
- computes features
- outputs regime probabilities
- outputs uncertainty index
B. Decision Layer
- maps regimes to actions:
- size multipliers
- strategy enable/disable
- risk caps
- portfolio weights
C. Monitoring Layer
- displays:
- regime probabilities over time
- regime flips frequency
- uncertainty index
- system health overlay (from your health framework)
The decision layer must be stable and conservative.
If the decision layer is allowed to be as complex as the regime engine, you simply move the overfitting problem one layer up.
13. The One Rule That Keeps Regime Detection Honest
The regime model must be judged by its decision outcomes, not by classification beauty.
A perfect classifier that causes you to overtrade, churn allocations, or suppress edge is a failure.
A simple classifier that reduces tail losses, stabilizes drawdown duration, and prevents structural mismatches is a success.
The most important test is:
Does regime detection reduce the probability of catastrophic misalignment?
Not:
Does it increase the backtest?
Conclusion: Regime Detection Is a Layer, Not an Edge
Regime detection is not alpha.
It is context.
Its value is in preventing you from applying logic where it does not belong, and in helping you manage risk when the environment changes.
A robust regime model is:
- layered (volatility, persistence, liquidity)
- probabilistic (not binary)
- conservative in decisions (throttle, not flip)
- validated walk-forward
- interpretable enough to debug
- focused on risk reduction, not performance inflation
In modern systematic trading, the best strategies are not those with perfect logic. They are those managed within the right environment.
Regime detection is how you define that environment.