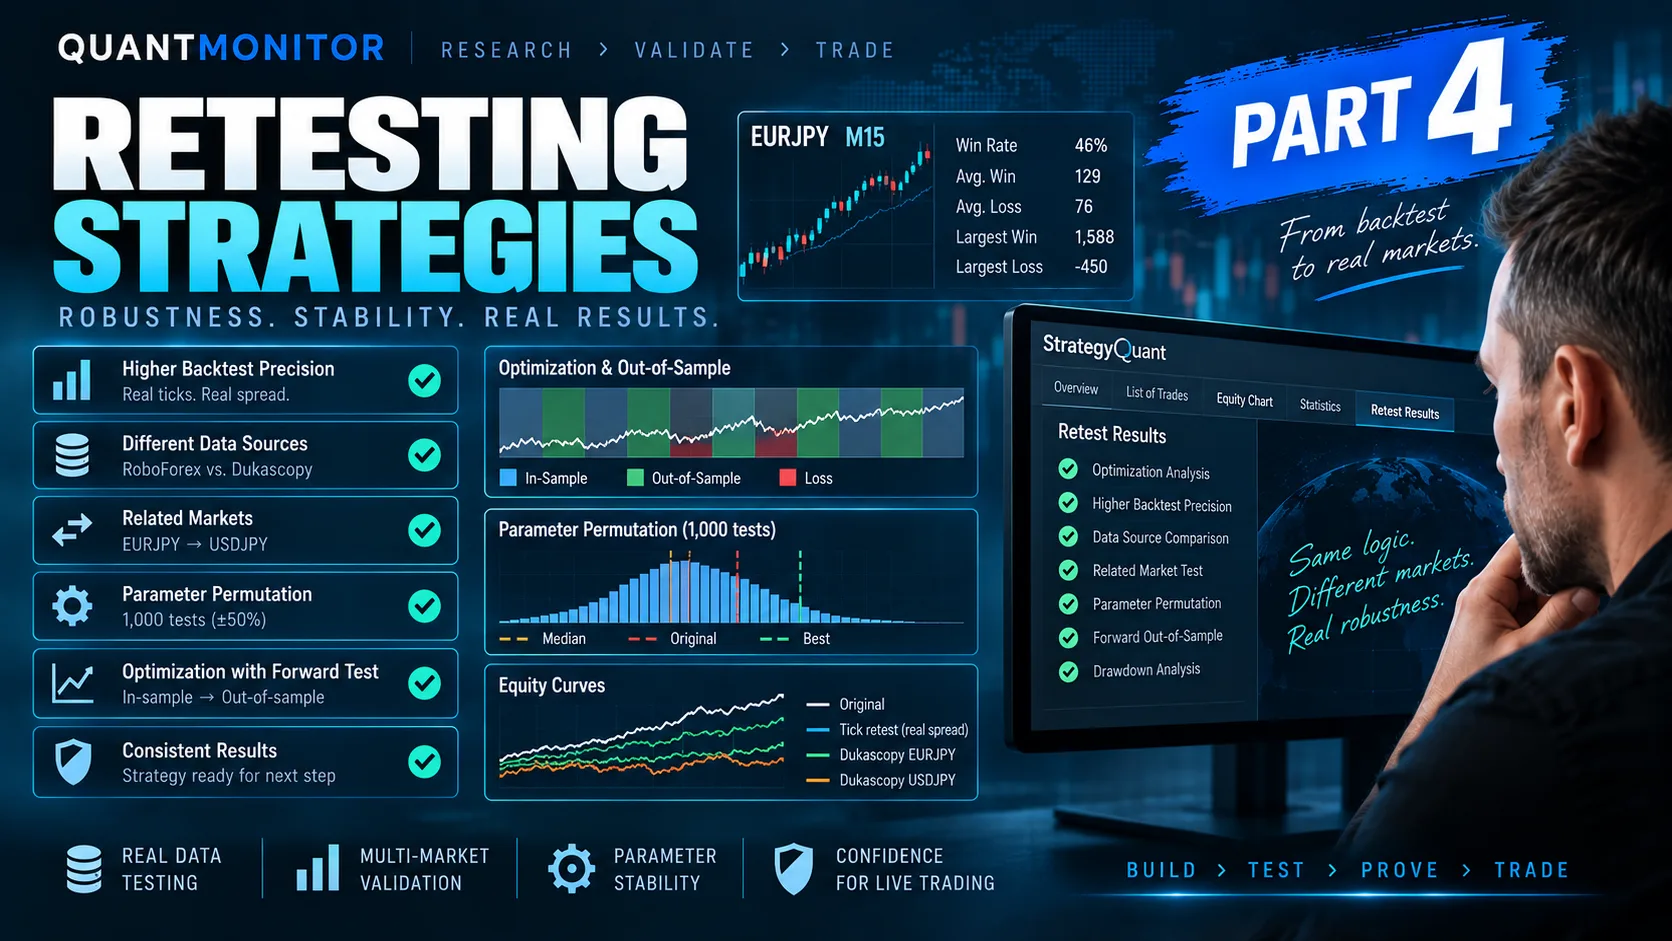
In the previous parts of this series, I showed how I generate strategies, how I filter entire groups of builds, and how I gradually move from broad cross-market research to more precise market-specific configurations.
This final part focuses on the next stage:
Retesting.
At this point, I am no longer interested in generating as many strategies as possible.
I already know which markets, timeframes, and templates work best for me.
Now I want to answer a different question:
Can the strategy survive more demanding validation without losing its basic characteristics?
That is what the retesting process is designed to find out.
Starting With a Strategy That Already Looks Healthy
For this example, I selected a strategy for:
EURJPY – M15
Before I run any additional robustness tests, I first look at the basic equity curve and statistics.
I want to see how the strategy behaves overall and whether the long and short sides both make sense.
The strategy in this example has a win rate of approximately:
46%
The Average Winning Trade is around:
129
The Average Losing Trade is around:
76
The Largest Losing Trade is around:
450
And the Largest Winning Trade is approximately:
1,588
The exact numbers are not important on their own.
What matters is that the relationships between them look statistically healthy.
I do not want a strategy where the whole result depends on one exceptional trade.
I also do not want a strategy where the average winner is too small relative to the average loser.
The statistics should make sense as a complete profile.
Looking at Performance Across Individual Years
Another thing I check before deeper retesting is the performance across individual years.
A strategy can have an attractive overall equity curve while most of the profit comes from only one short period.
That is not what I want.
I prefer to see that the strategy is able to function across different market environments.
That does not mean every year has to be profitable.
Some periods can naturally be weaker.
The important question is whether the behaviour remains reasonable and whether the strategy survives different market conditions without completely breaking down.
Out-of-Sample and True Out-of-Sample Come First
The strategies I select for deeper retesting have already passed:
- Out-of-Sample testing
- True Out-of-Sample testing
This is important.
I do not run complex robustness testing on every strategy generated by the build.
That would be inefficient.
Instead, I first filter aggressively.
Only strategies with a healthy statistical profile and acceptable performance in unseen data move forward.
In my experience, once a strategy reaches this stage, approximately 95% of the candidates I select also pass the additional retests without major problems.
This is mainly because the earlier filtering process is already quite strict.
Higher Backtest Precision Testing
One of the most important retests for me is:
Higher Backtest Precision Testing
Here, I test the strategy on:
- real tick data
- real spread
The purpose is simple.
I want to eliminate strategies that only work because the original backtest was too optimistic or too imprecise.
Some strategies can appear excellent when tested using simplified price data.
But if their edge depends on extremely small price movements, unrealistic fills, or optimistic spread assumptions, the results can disappear once the test becomes more precise.
Testing on real ticks with real spread gives me much more confidence that the strategy is not simply exploiting weaknesses in the backtest engine.
Why This Test Matters
This type of test is particularly important for strategies with:
- very small Take Profit levels
- very small Stop Loss levels
- frequent trading
- short holding periods
- sensitivity to spread
- sensitivity to execution
A system that looks good on simplified data may completely change once realistic market microstructure is introduced.
That is exactly what I want to detect before considering live deployment.
Testing the Same Market on Different Data
Another interesting test is to run the same strategy on data from another provider.
In this example, the original strategy was built on:
EURJPY using RoboForex data
I then test it on:
EURJPY using Dukascopy data
This is a very useful robustness check.
The instrument is still the same.
The market is still the same.
But the data source is different.
Small differences in:
- tick structure
- spread
- price formation
- historical data quality
can reveal whether the strategy is overly dependent on the exact dataset used during development.
If the strategy still behaves reasonably on another data source, that is a positive sign.
Testing on a Related Market
I also like to test the strategy on another related instrument.
In this example, I use:
USDJPY with Dukascopy data
The goal is not necessarily to prove that the strategy can be traded on USDJPY.
That is not the main point.
The real purpose is to observe whether the logic is completely isolated to one historical dataset or whether some of its behaviour transfers to a related market.
This gives me another perspective on the underlying robustness of the trading logic.
System Parameter Permutation
Another important test is:
System Parameter Permutation
Here, I run approximately:
1,000 tests
The basic idea is to change the strategy parameters around their original values.
For example, I can vary the parameters within approximately:
-50% to +50%
This allows me to see what happens when the strategy is moved away from the exact parameter combination that produced the original result.
This is one of the most useful robustness tests because it addresses a fundamental question:
Is the strategy sitting on a broad stable area, or on one isolated perfect parameter combination?
Why Parameter Stability Matters
A strategy with one perfect setting and poor results everywhere around it is suspicious.
That is often a sign of overfitting.
A more robust strategy usually has a wider neighbourhood of parameter combinations that still produce acceptable results.
The results do not need to be identical.
They should not be.
But I want to see that reasonable changes in the parameters do not immediately destroy the strategy.
That is what the System Parameter Permutation test helps me evaluate.
Looking at the Distribution
After the test is finished, I do not look only at the best result.
I am much more interested in the entire distribution.
For example:
- How many variations remain profitable?
- Where is the median?
- Where does the original strategy sit?
- How wide is the distribution?
- What happens to drawdown?
- Are there many catastrophic results?
In one of my examples, approximately:
625 parameter variations were profitable
That gives me useful information about the stability of the strategy around its original configuration.
The Median Is Often More Interesting Than the Best Result
The best result is usually not the most important number.
The median can often tell me much more.
The original strategy may sit near the top of the distribution.
That is not automatically bad.
But if the median is still acceptable, I know that many nearby parameter combinations also work reasonably well.
This gives me more confidence that I am not looking at a single lucky parameter combination.
Drawdown Distribution
I also pay close attention to:
- Drawdown distribution
- Maximum Drawdown
This is extremely important.
Profit is only one side of the equation.
If slight parameter changes cause drawdown to increase dramatically, the strategy may be much less stable than the original backtest suggests.
I therefore compare:
- the original strategy
- the median of the parameter permutations
- the worst areas of the distribution
Again, I am not looking for perfection.
I am looking for consistency.
Optimization With Forward Testing
The next test combines optimization with out-of-sample evaluation.
The idea is straightforward.
I take an optimization period.
Inside that period, the parameters are optimized.
Then those optimized settings are tested on a completely unseen out-of-sample period.
This process is repeated multiple times.
So instead of asking:
“Can I optimize the strategy to look good?”
I ask:
“Do optimized parameter sets continue to work after the optimization period ends?”
That is a much more meaningful question.
The Logic Behind Forward Testing
The optimization period represents the past.
The out-of-sample period represents the future from the perspective of that optimization.
This creates a more realistic research process.
The strategy is not allowed to know what happens next.
I optimize parameters using only the data available in the optimization window.
Then I test those parameters on unseen data.
This process is repeated across multiple periods.
Reading the Results
After the retests are complete, I analyze the optimization periods and the subsequent out-of-sample results.
For each period, I can see the net profit generated during the unseen out-of-sample segment.
In the example shown in the video, most of the periods were profitable.
Only two periods were slightly negative.
That is acceptable to me.
I do not expect every single out-of-sample segment to make money.
What matters is the overall consistency of the process.
Profitable Optimization Results
I also look at how many optimization runs ended up profitable.
In this particular example, approximately:
625 optimization results were profitable
Again, the number itself is not the final decision criterion.
But combined with the distribution, the drawdown characteristics, and the out-of-sample results, it helps build a more complete picture.
Comparing Equity Curves
One of my favourite parts of the analysis is comparing the equity curves.
I typically look at several versions:
- Original strategy
- Tick-data retest with original spread
- Same market using another data provider
- Related market using another data provider
- Forward optimization results
- True Out-of-Sample equity
This is where many potential problems become visually obvious.
If all versions remain reasonably similar, that is a good sign.
If one curve collapses completely, I want to understand why.
Original Equity vs. True Out-of-Sample Equity
One very useful comparison is between:
Original equity
and
True Out-of-Sample equity
The original curve includes the full historical behaviour.
The True Out-of-Sample curve is built only from the unseen periods that were not part of the corresponding optimization process.
This gives me a much cleaner view of how the strategy behaves when it is repeatedly exposed to data it has not seen before.
The True Out-of-Sample equity will often be lower than the original equity.
That is normal.
I am more interested in whether the general shape remains healthy.
What I Want to See
I do not expect all retests to produce identical results.
That would actually be unrealistic.
Instead, I want to see:
- similar general behaviour
- reasonable profitability
- controlled drawdown
- stable parameter neighbourhoods
- acceptable results on different data
- acceptable performance on related markets
- positive or reasonable out-of-sample periods
A robust strategy should tolerate some changes.
It should not depend on one exact historical path.
My Retesting Workflow
The process can be summarized like this:
- Select a strategy with healthy initial statistics.
- Confirm that it passed Out-of-Sample testing.
- Confirm that it passed True Out-of-Sample testing.
- Run Higher Backtest Precision Testing.
- Use real tick data and real spread.
- Test the same market using another data source.
- Test a related market.
- Run System Parameter Permutation.
- Vary parameters around the original values.
- Analyze the distribution, median, and drawdown.
- Run optimization with forward out-of-sample testing.
- Compare original equity with True Out-of-Sample equity.
- Decide whether the strategy remains statistically healthy.
This is the final validation stage of my build process.
The Most Important Principle
The whole series can be summarized in one idea:
Do not rely on one good backtest.
A strategy should survive multiple layers of testing.
It should work:
- on unseen data
- on more precise data
- with realistic spread
- with modified parameters
- on another data source
- and ideally show reasonable behaviour on related markets
The more independent evidence I have, the more confidence I can have that the strategy is not simply the result of overfitting.
From Build to Live Trading
The complete workflow therefore moves through several stages.
First:
Broad discovery
I test many markets, timeframes, and templates.
Then:
Filtering
I identify the combinations that repeatedly generate strong strategies.
Then:
Market-specific builds
I adjust Take Profit, Stop Loss, trailing, ATR, and other ranges to the behaviour of the individual market.
And finally:
Retesting and robustness validation
Only after a strategy survives all of these stages do I consider it a serious candidate for live trading.
Final Thoughts
This retesting stage is where I stop asking whether the backtest looks good and start asking whether the strategy deserves to be trusted.
That is a very different mindset.
The purpose of robustness testing is not to make the strategy look better.
It is to try to break it.
If the strategy survives realistic spread, higher precision, different datasets, parameter changes, optimization shifts, and unseen periods, then I have much stronger evidence that the underlying logic may be real.
That still does not guarantee future performance.
Nothing does.
But it gives me a much better foundation for deciding which strategies are worth taking into the next stage.
And with that, this series about my StrategyQuant build and retesting process is complete.
Disclaimer: This content is for educational and research purposes only. Trading and investing involve substantial risk. Strategy examples, backtests, simulations, optimizations, and hypothetical results have inherent limitations and do not guarantee future performance. Past performance is not necessarily indicative of future results.