How Weekly, Monthly, and Multi-Year Structures Guide Long-Term Price Movement
Introduction: Why Time Comes Before Price
Markets are almost always discussed in terms of price.
How high. How low. How far. How fast.
Time, by contrast, is treated as a neutral backdrop — a passive axis along which price happens to move. This assumption is one of the most persistent blind spots in market analysis.
In reality, time is not passive.
Time constrains markets.
Time exhausts trends.
Time forces resolution.
Price fluctuates freely within short horizons, but no imbalance can persist indefinitely. Every sustained move eventually encounters a temporal boundary where behavior must change. Understanding markets without understanding time is therefore incomplete — not because price is irrelevant, but because price alone cannot explain when markets transition.
This month focuses on time as the dominant market force: not as a prediction tool, but as a structural framework that governs how and when price movement unfolds.
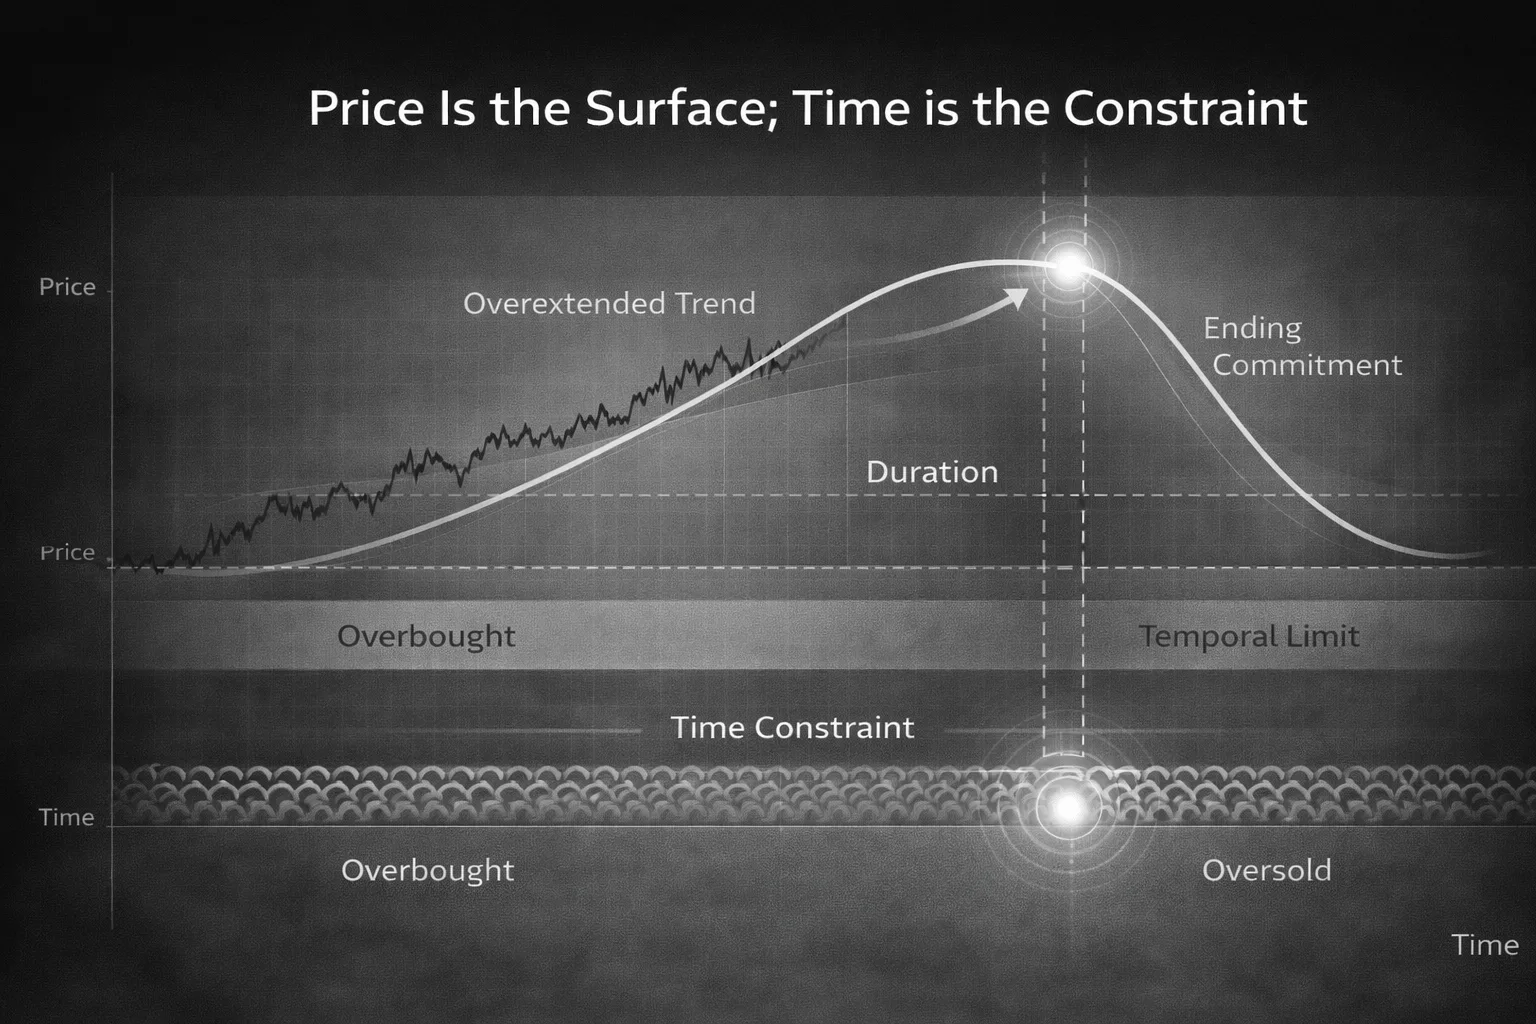
Price Is the Surface; Time Is the Constraint
Price is what we observe.
Time is what limits.
Markets can remain overbought, oversold, euphoric, or depressed far longer than participants expect. The reason reversals feel surprising is not that they are random, but that price-based logic ignores duration.
A trend does not end simply because it has moved “too far.”
It ends because it has existed long enough.
Time acts as a silent regulator. It determines how long capital can remain committed in one direction before behavior shifts. When participation becomes saturated and marginal commitment fades, price becomes vulnerable — even if no visible catalyst exists.
This is why markets often reverse in environments that appear fundamentally supportive. By the time consensus forms, the temporal budget of the move has already been consumed.
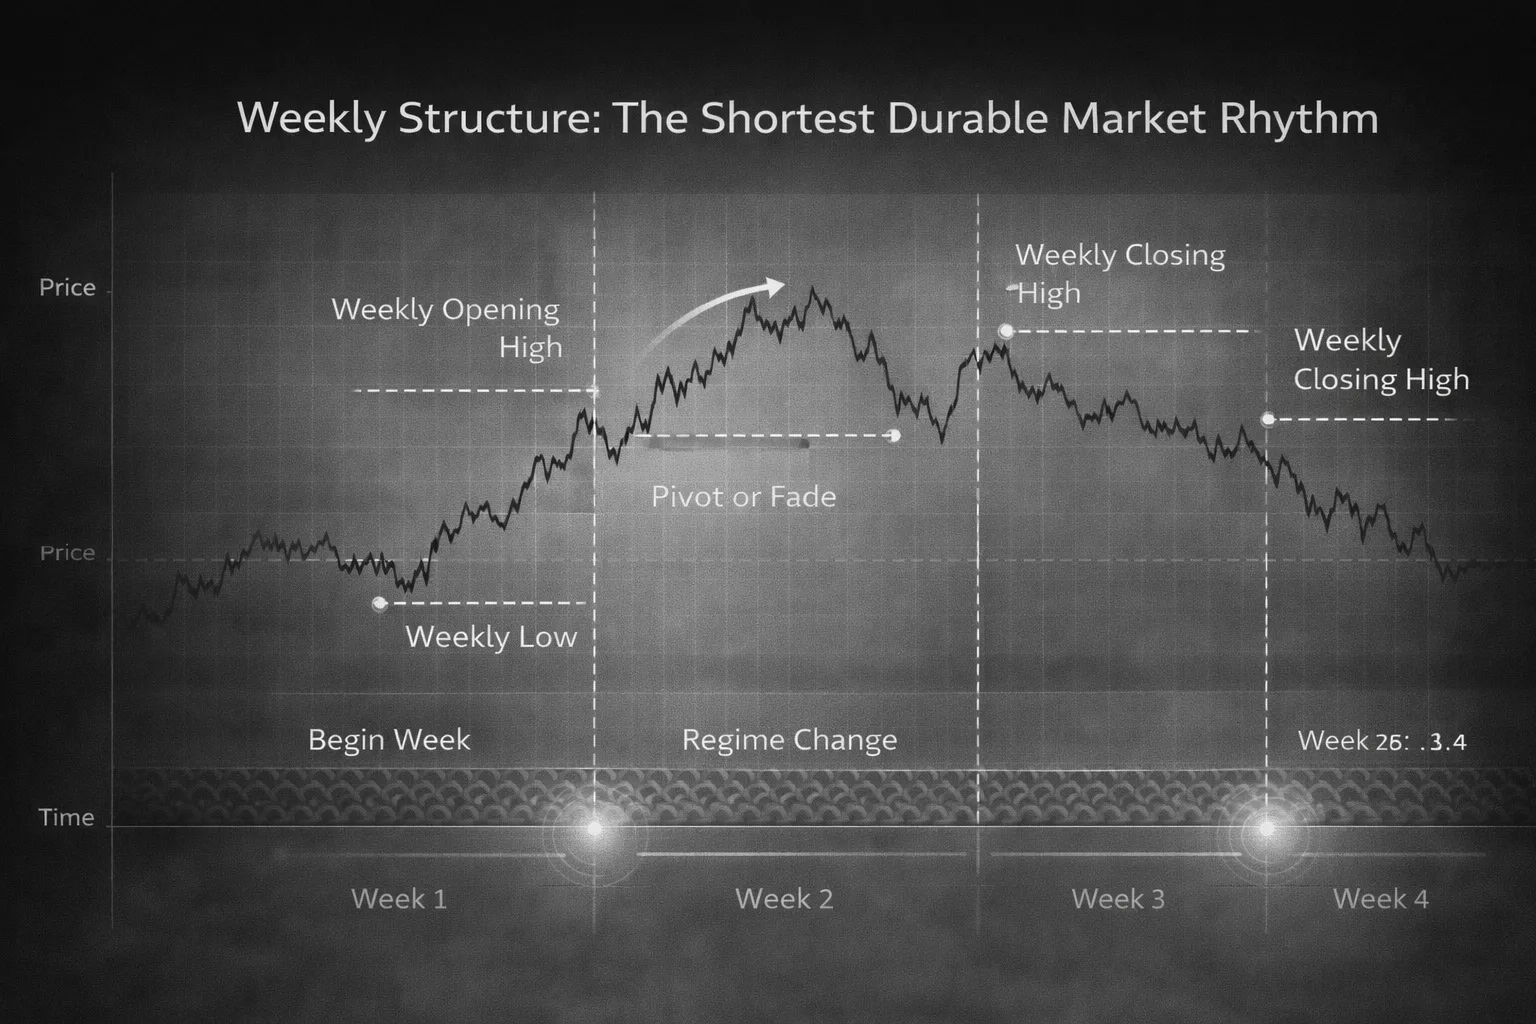
Weekly Structure: The Shortest Durable Market Rhythm
Among all timeframes, the weekly structure occupies a unique position. It is short enough to capture active market behavior, yet long enough to reflect institutional positioning.
Weekly cycles persist because capital allocation decisions are rarely made on a daily basis. Funds rebalance weekly. Risk is reassessed weekly. Performance is evaluated weekly. As a result, weekly highs, lows, and closes carry information that intraday movement cannot.
Markets frequently reveal their intent at weekly boundaries. Failed breakouts, trend accelerations, and regime shifts often cluster around the end of one week and the beginning of the next. This is not coincidence — it reflects the rhythm of decision-making.
Ignoring weekly structure forces traders to interpret noise as signal.
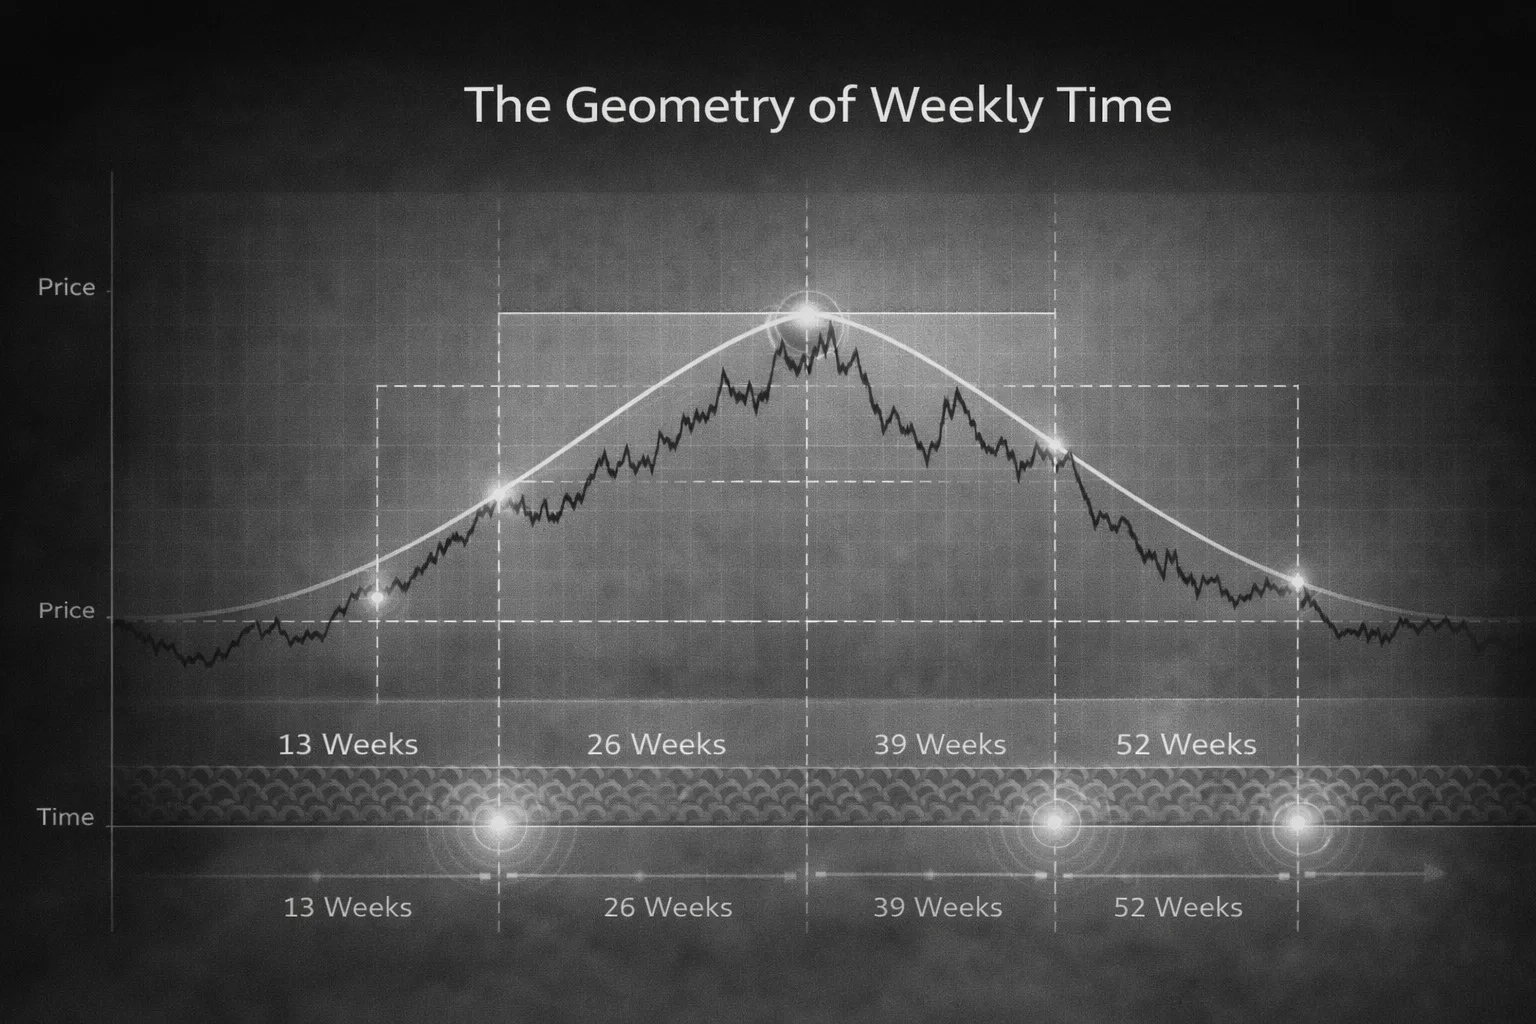
The Geometry of Weekly Time
Weekly time is not linear. It is modular.
Markets historically respond to recurring week counts — not because numbers are magical, but because human organization creates periodic pressure points. Investment horizons, reporting cycles, and risk reviews naturally segment time into recognizable intervals.
As trends mature, the probability of behavioral change increases at these temporal intersections. Importantly, this does not mean price must reverse — only that the probability of continuation changes.
Weekly timing provides context. It tells us when to expect increased sensitivity, not what direction price must take.
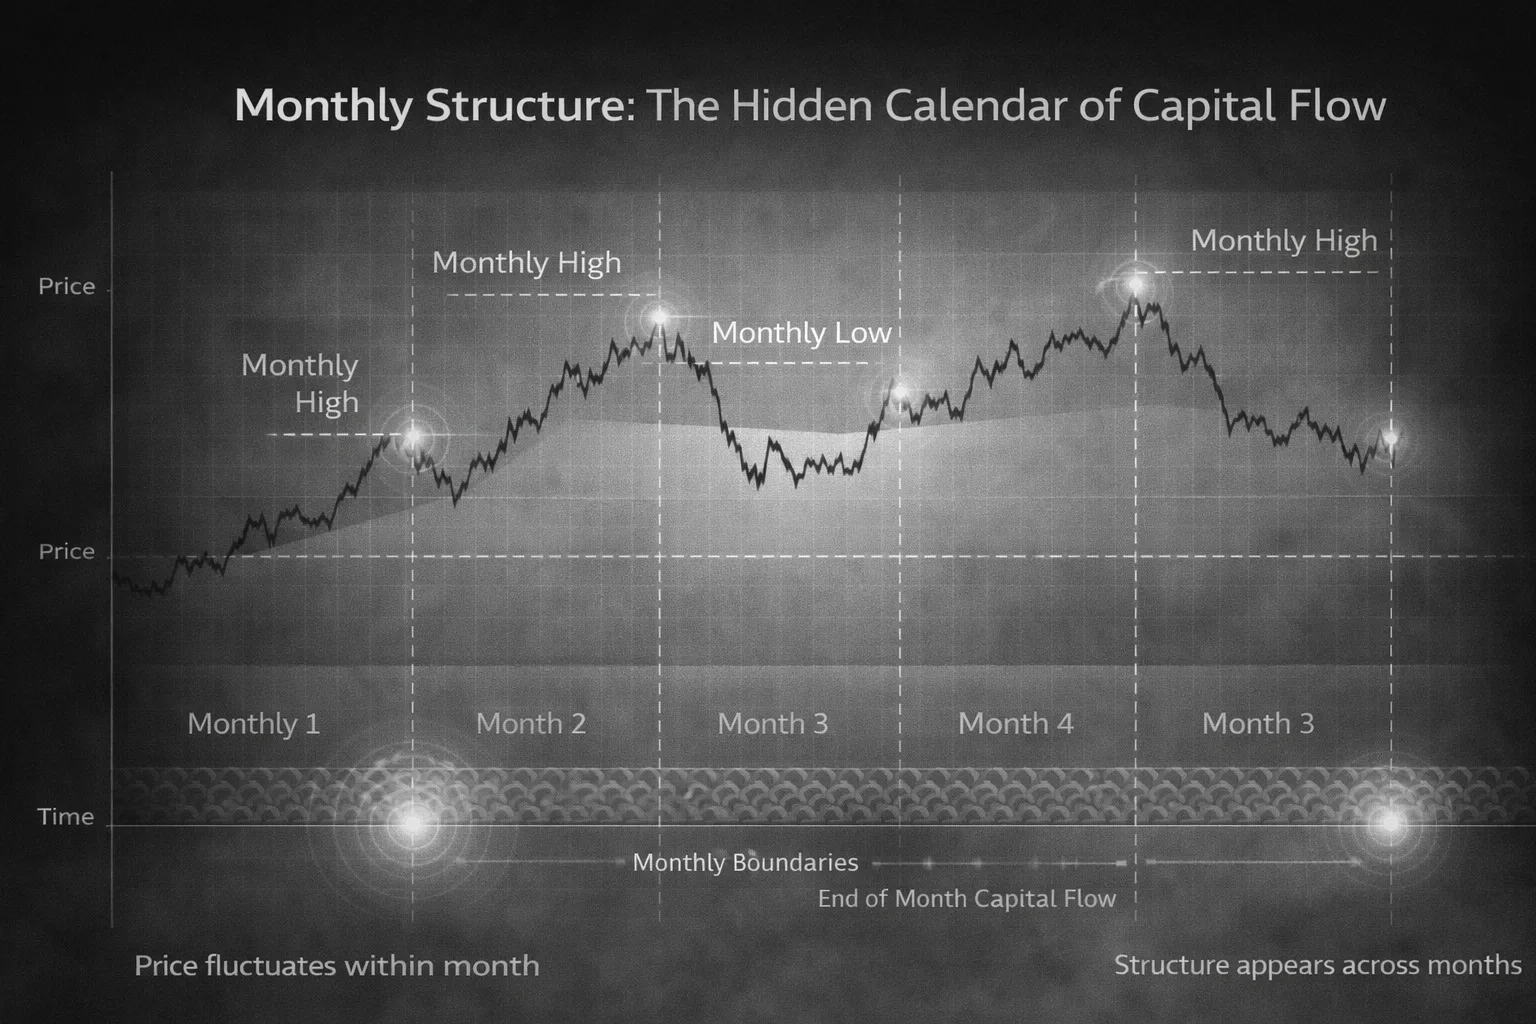
Monthly Structure: The Hidden Calendar of Capital Flow
Monthly timeframes reveal behavior that daily charts obscure.
Capital is allocated monthly. Portfolios are evaluated monthly. Exposure is adjusted monthly. These recurring processes introduce calendar-based structure into markets, even when no obvious seasonal narrative exists.
Monthly opens and closes matter because they define reference points for longer-term positioning. A market that closes strong at month-end communicates something very different from one that fades — even if daily volatility appears similar.
Monthly structure does not predict outcomes. It frames expectations. It helps distinguish between trends that are building participation and those that are merely fluctuating within noise.
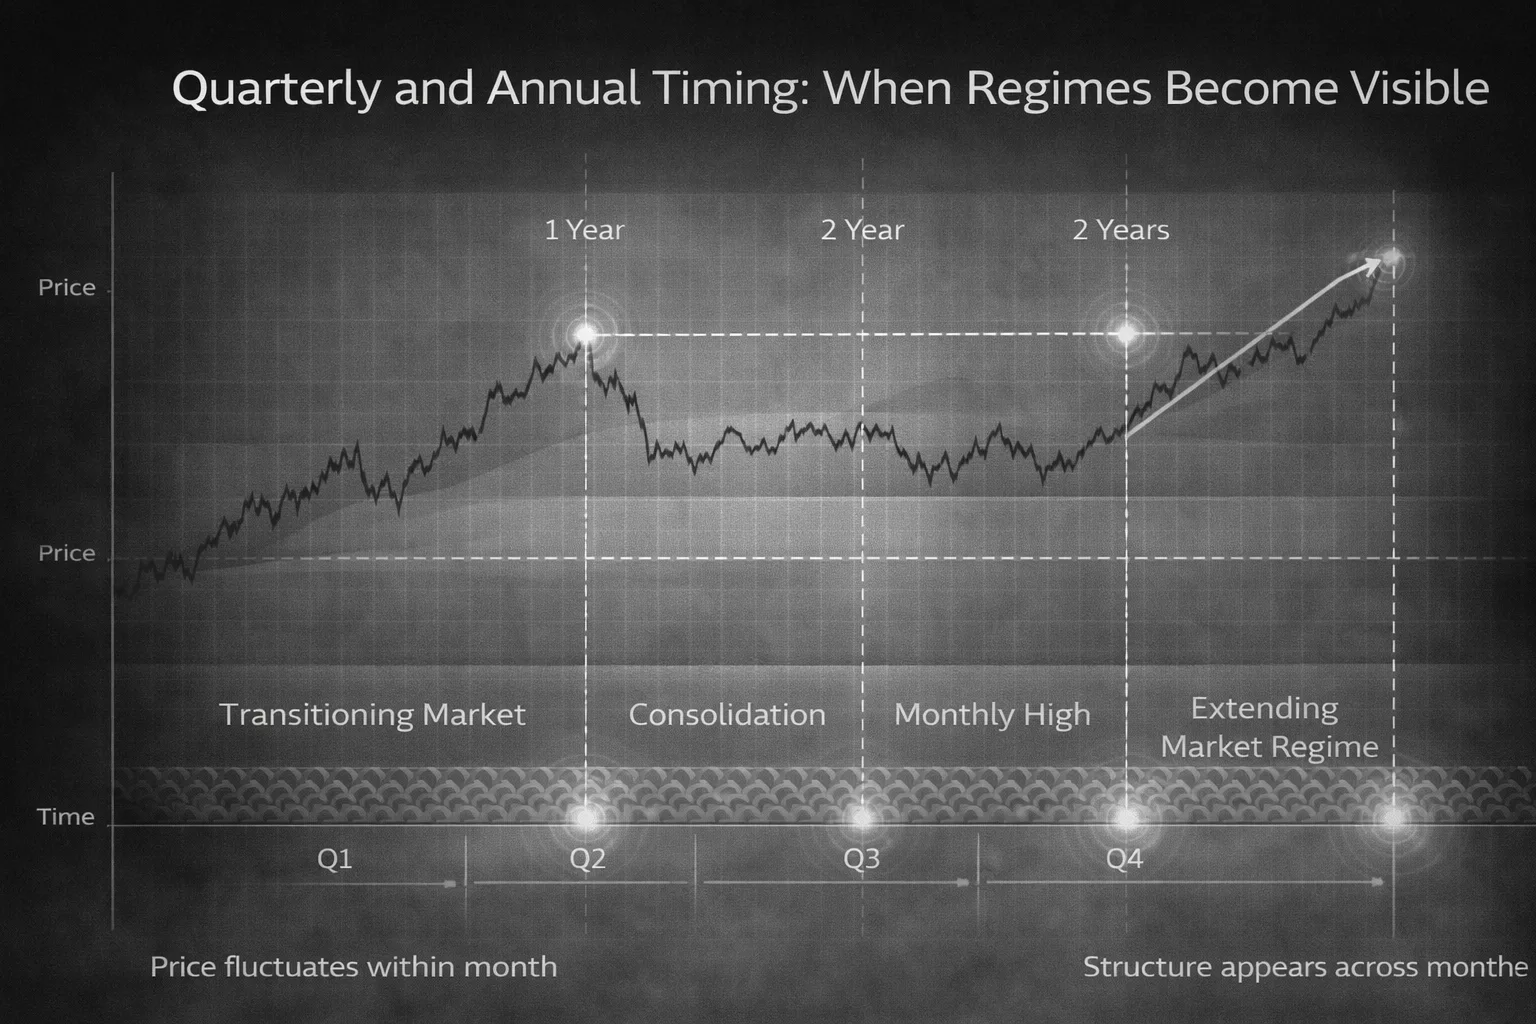
Quarterly and Annual Timing: When Regimes Become Visible
As time horizons expand, structure becomes clearer.
Quarterly and annual cycles are not trading signals — they are regime identifiers. They reveal whether markets are transitioning, consolidating, or extending existing behavior.
Many regime shifts are only obvious in hindsight because they unfold slowly. What appears indecisive on a daily chart often resolves cleanly when viewed through a quarterly or annual lens.
This is why higher timeframes matter: they compress noise and expose structure.
Markets do not change character abruptly. They transition through time.
Multi-Year Timing: Why Large Moves Cluster
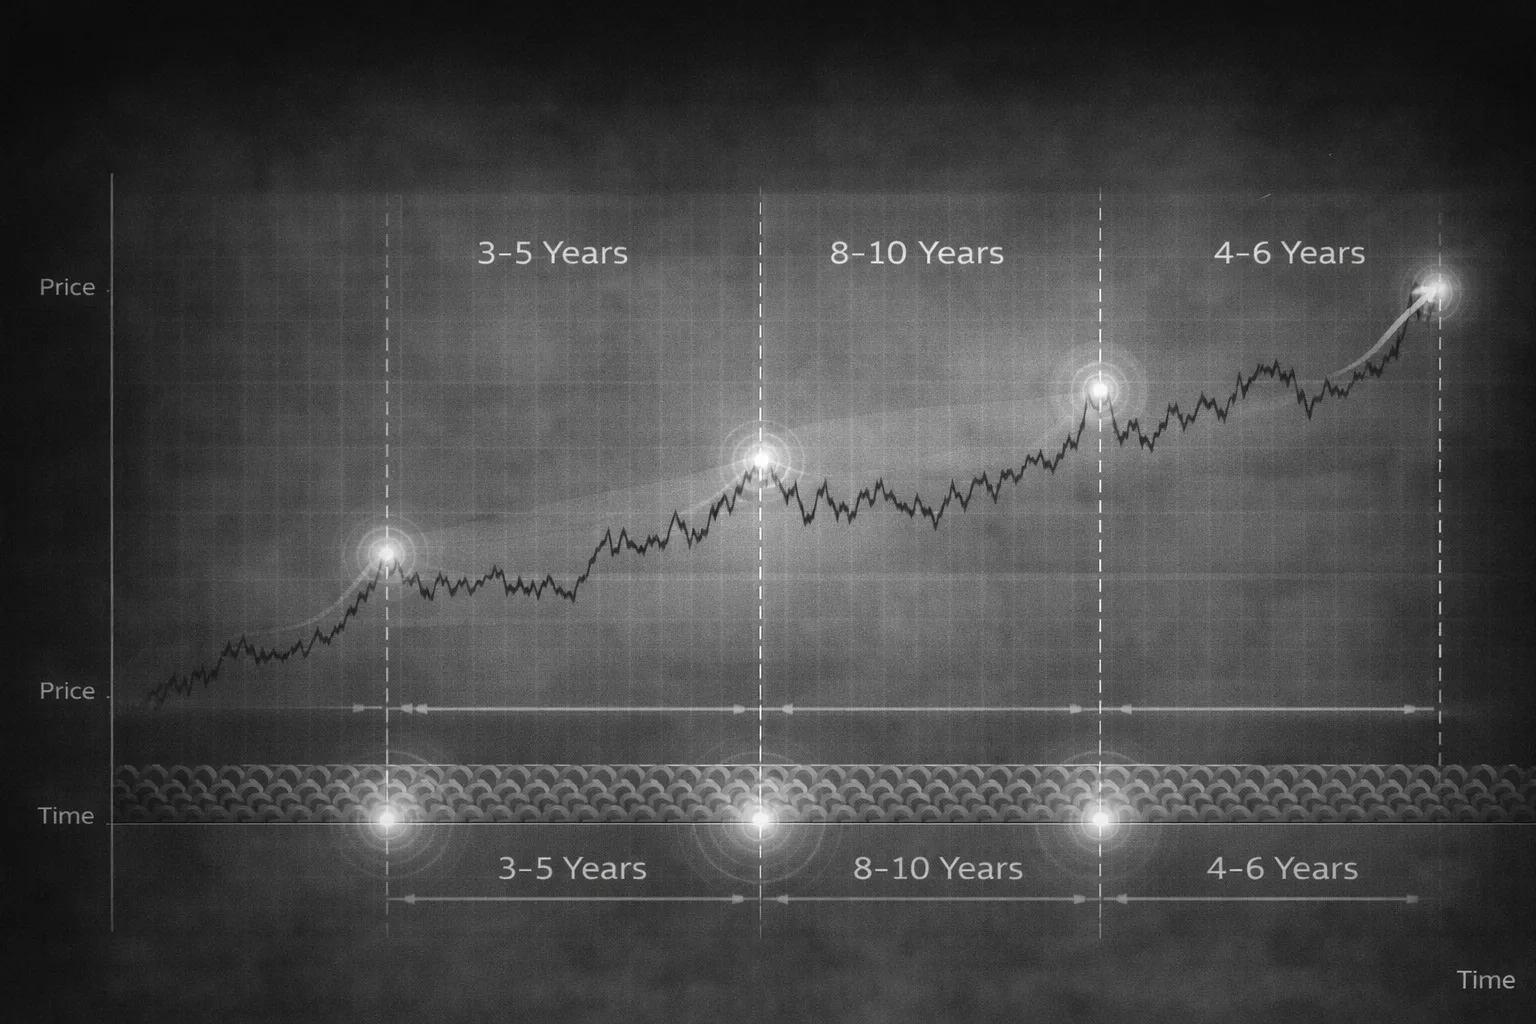
Large market moves rarely occur in isolation. They cluster.
Extended trends, major reversals, and prolonged consolidations often emerge within multi-year timing structures. This does not imply determinism — it reflects the reality that capital allocation decisions at scale require time to build and unwind.
Multi-year timing helps explain why markets can remain directionless for long periods and then suddenly move decisively. The movement itself may appear abrupt, but the preparation was slow.
Understanding multi-year timing is not about forecasting distant prices. It is about recognizing when markets are entering environments where structural change becomes possible.
Time and Trend: Why Trends Exist at All
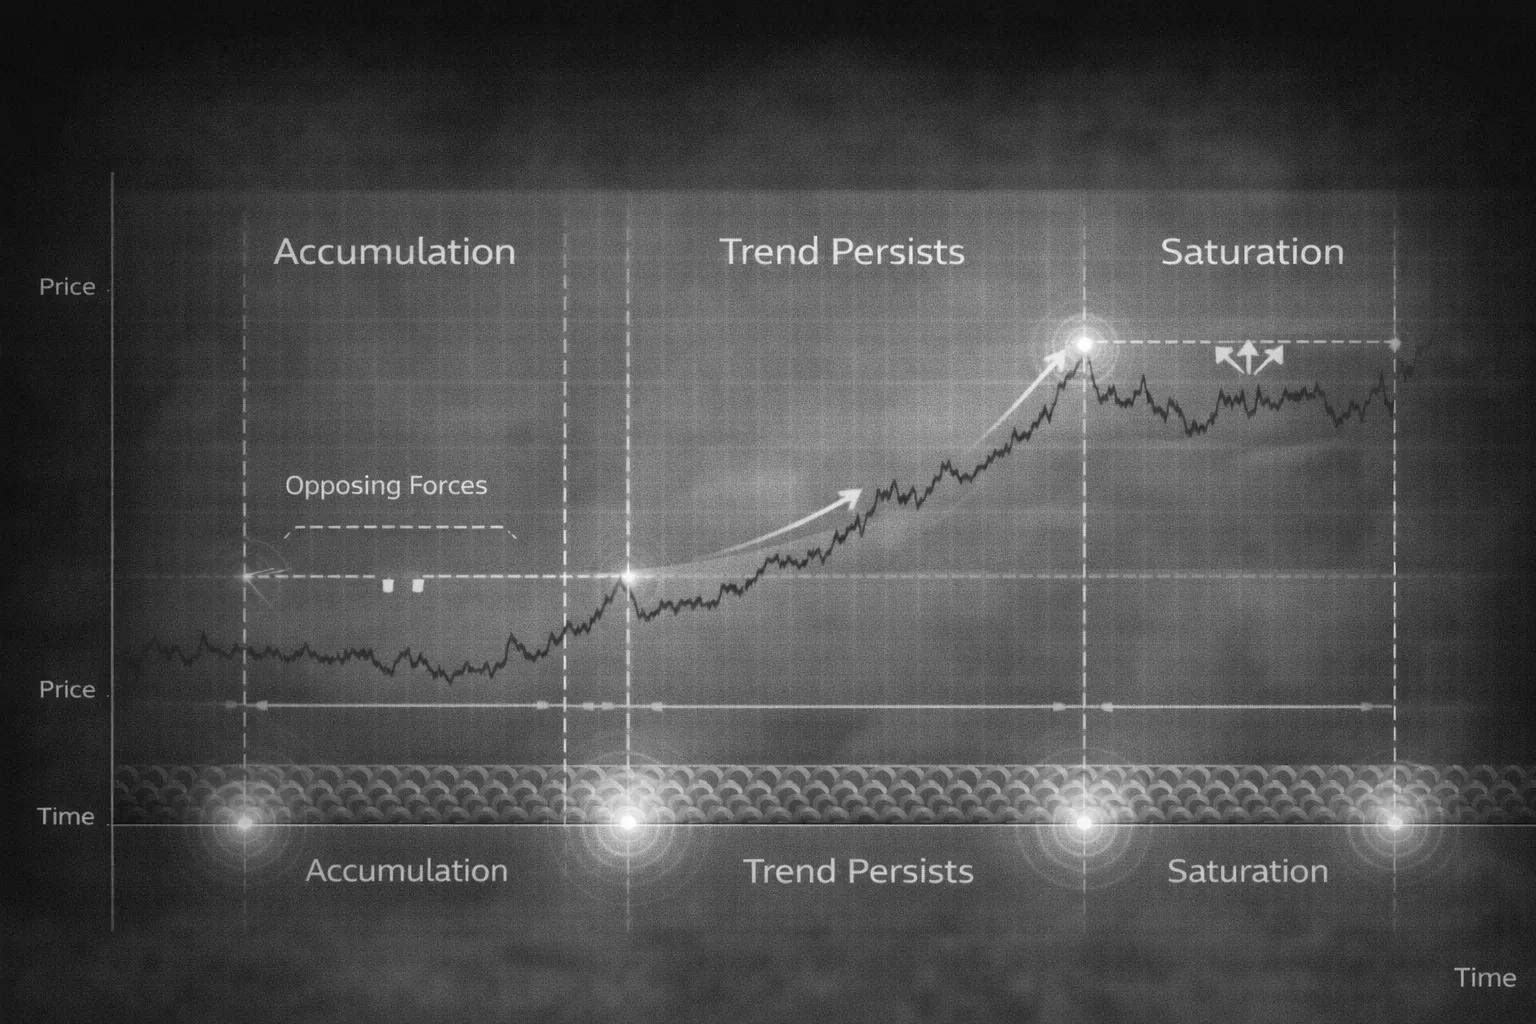
Trends form because imbalance cannot persist indefinitely.
During accumulation, opposing forces neutralize each other. Price compresses. Volatility contracts. Time passes.
When balance breaks, price moves. Not because of momentum alone, but because time has allowed pressure to build.
Once a trend begins, time works in the opposite direction. The longer a trend persists, the more participants anchor to it. Continuation becomes easier — until saturation appears. At that point, time becomes the enemy of the trend.
Trends are therefore temporal phenomena as much as directional ones.
Time as Context, Not Prediction
The most common misuse of time is attempting to turn it into a forecast.
Time does not tell us what will happen next.
It tells us where we are.
Used correctly, time defines context:
- when risk expands
- when patience is required
- when expectations should be adjusted
Used incorrectly, time becomes superstition.
The discipline lies in treating time as a framework, not a trigger.
Implications for Systematic Trading
Systematic strategies fail when they assume market conditions are constant.
Markets change character because time forces them to.
Strategies perform differently across time structures because volatility, participation, and behavior evolve. Ignoring time leads to overfitting. Respecting time leads to robustness.
Time-based context does not replace execution logic — it governs when that logic is appropriate.
Conclusion: Markets Move Because Time Demands Resolution
Markets do not move randomly through time.
They move because of time.
Imbalances build, persist, and resolve within temporal constraints that shape behavior long before price reflects it. Weekly, monthly, and multi-year structures are not artifacts — they are the scaffolding of market movement.
Understanding time does not grant foresight.
It grants orientation.
And in markets, orientation is often the difference between reacting to noise and responding to structure.