I’ve traded since 2015 — Forex first, then equity indices, and gradually I replaced isolated ideas with testable algorithms, portfolio construction and live monitoring. This is the trader profile behind the QuantMonitor research: what changed, what I actually run, and where you can check the record for yourself.
Systematic trading, in one line, means converting a market idea into rules that can be tested, monitored and repeated. Everything below is an attempt to do exactly that — and to leave the evidence out in the open.
- Trading since 2015 — Forex first, then indices and multi-asset systems.
- At QuantMonitor — co-owner and Chief Algorithm Developer.
- Current research universe — Brent, EURJPY, XAUUSD, BTCUSD and Dow Jones.
- Current priority — live observation, execution quality and portfolio behaviour.
Early losses were part of the research process
My first years were not a straight line from an idea to a profitable system. I made the usual mistakes: too much attention on individual trades, too little on sample size, and too much confidence in behaviour that had only worked during one market phase.
Over time I built algorithms by hand. Some performed well for meaningful periods; others weakened when volatility, trend structure or participation changed. That inconsistency was useful — it forced me to stop asking whether a setup looked convincing and start asking whether the evidence was broad enough to trust.
A strategy is not robust because it has a smooth backtest. It is robust when its logic survives different data, changing regimes and imperfect live execution.
From hand-built rules to template-based algorithm generation
My work at QuantMonitor now focuses on generating algorithms from structured templates. A template defines the permitted logic and the search space before generation starts — because an unrestricted builder discovers impressive historical coincidences far faster than it discovers a durable edge.
I use StrategyQuant-based generation together with MetaTrader 5 validation and QuantMonitor’s own monitoring tools. The goal is not the largest possible databank. It’s a smaller set of understandable systems with controlled complexity — and then rejecting most of them. The rules that survive:
- Separate development from validation. In-sample data develops the idea; out-of-sample and true out-of-sample periods test whether it travels.
- Prefer fewer degrees of freedom. Every extra parameter is another way to fit noise. Simpler logic is easier to challenge and to monitor.
- Stress the result. Walk-forward analysis, Monte Carlo testing and stability checks matter more than one optimised equity curve.
- Evaluate the portfolio, not just the strategy. Correlation, drawdown overlap and return concentration can matter more than the best standalone system.
Market knowledge still matters
Algorithmic generation is not blind search. Years of watching Forex, indices, metals, energy and crypto have given me a working sense of which entry bands and behaviours are plausible on which instruments. Gold responds differently to volatility expansion than EURJPY. BTCUSD tolerates a lower win rate when the payoff stays asymmetric. Dow Jones adds a different index factor and different timing. Brent needs its own treatment of volatility and energy-market behaviour.
Over the last year my main attention has been on Brent, EURJPY, XAUUSD, BTCUSD and Dow Jones. The database analysis below covers EURJPY, XAUUSD, BTCUSD and US30 — Brent is part of the research universe but isn’t included in this four-strategy report.
A worked portfolio example from the QuantMonitor database
The research database combines reconstructed closed trades and daily equity from four SQLite databases, over 1 January 2018 to 17 July 2026. Each strategy is treated as a separate 10,000-unit sleeve, for a normalised starting portfolio of 40,000.
Important: these are normalised research results combining backtest data with a short live segment. They are not the return history of the public RoboForex account, and not a claim about the actual account size.
| Metric | Value |
|---|---|
| Net portfolio profit | 7,121.24 (normalised units) |
| Return on the 40,000 start | 17.80% |
| Max normalised portfolio drawdown | 0.59% |
| Reconstructed closed trades | 2,214 |
| Portfolio profit factor | 1.63 |
| Annualised Sharpe (calendar-day returns) | 2.35 |
| Positive months | 82.5% of a 103-month sample |
| Average pairwise monthly correlation | −0.01 |
Broken down by strategy:
| Strategy | Net profit | Return | Max DD | Profit factor | Win rate | Trades | Sharpe |
|---|---|---|---|---|---|---|---|
| EURJPY | 2,026.29 | 20.26% | 2.53% | 1.52 | 48.2% | 446 | 1.15 |
| XAUUSD | 2,539.39 | 25.39% | 1.66% | 1.95 | 54.8% | 480 | 1.67 |
| BTCUSD | 1,285.47 | 12.85% | 1.21% | 1.44 | 32.1% | 722 | 0.92 |
| US30 | 1,270.09 | 12.70% | 1.05% | 1.70 | 51.2% | 566 | 1.43 |
Source: QuantMonitor portfolio report dated 17 July 2026. Percentages use equal 10,000-unit analytical sleeves; the US30 tester deposit was normalised to avoid a misleading comparison.
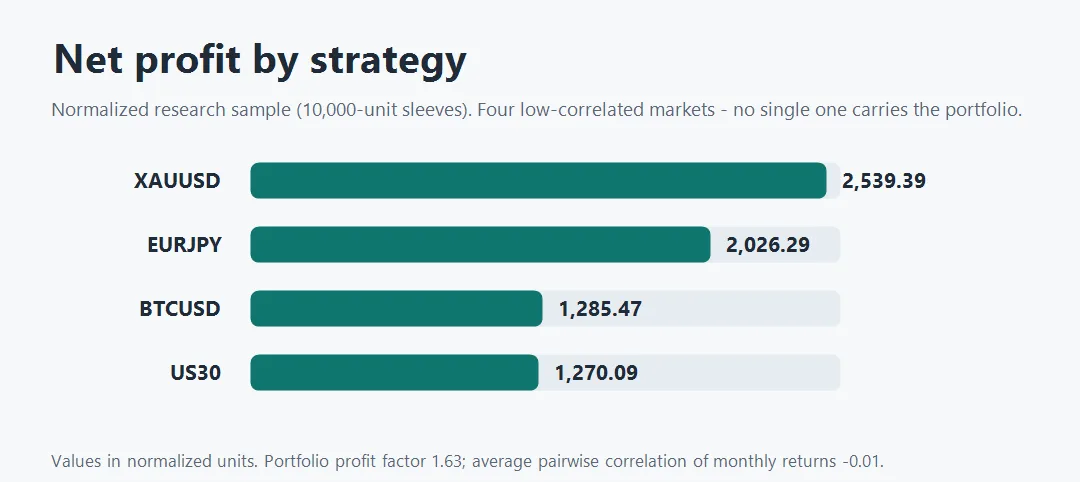
XAUUSD was the strongest standalone contributor; EURJPY was a second stable pillar. BTCUSD won only 32.1% of its trades — but its average winner was 3.04× the size of its average loser. US30 added a separate equity-index factor and different timing.
The portfolio result was stronger than the individual statistics suggest, because the monthly return correlations were low: average pairwise correlation −0.01, diversification ratio 2.00. In plain terms, the systems didn’t usually take their deepest losses at the same time.
What one year of demo observation looked like
Backtesting answers whether a rule worked in recorded data. Forward observation answers whether it behaves as expected when time only moves one way. Over the last year I used the QuantMonitor Portfolio Overlay inside MT5 to compare each strategy’s equity curve with the combined portfolio.
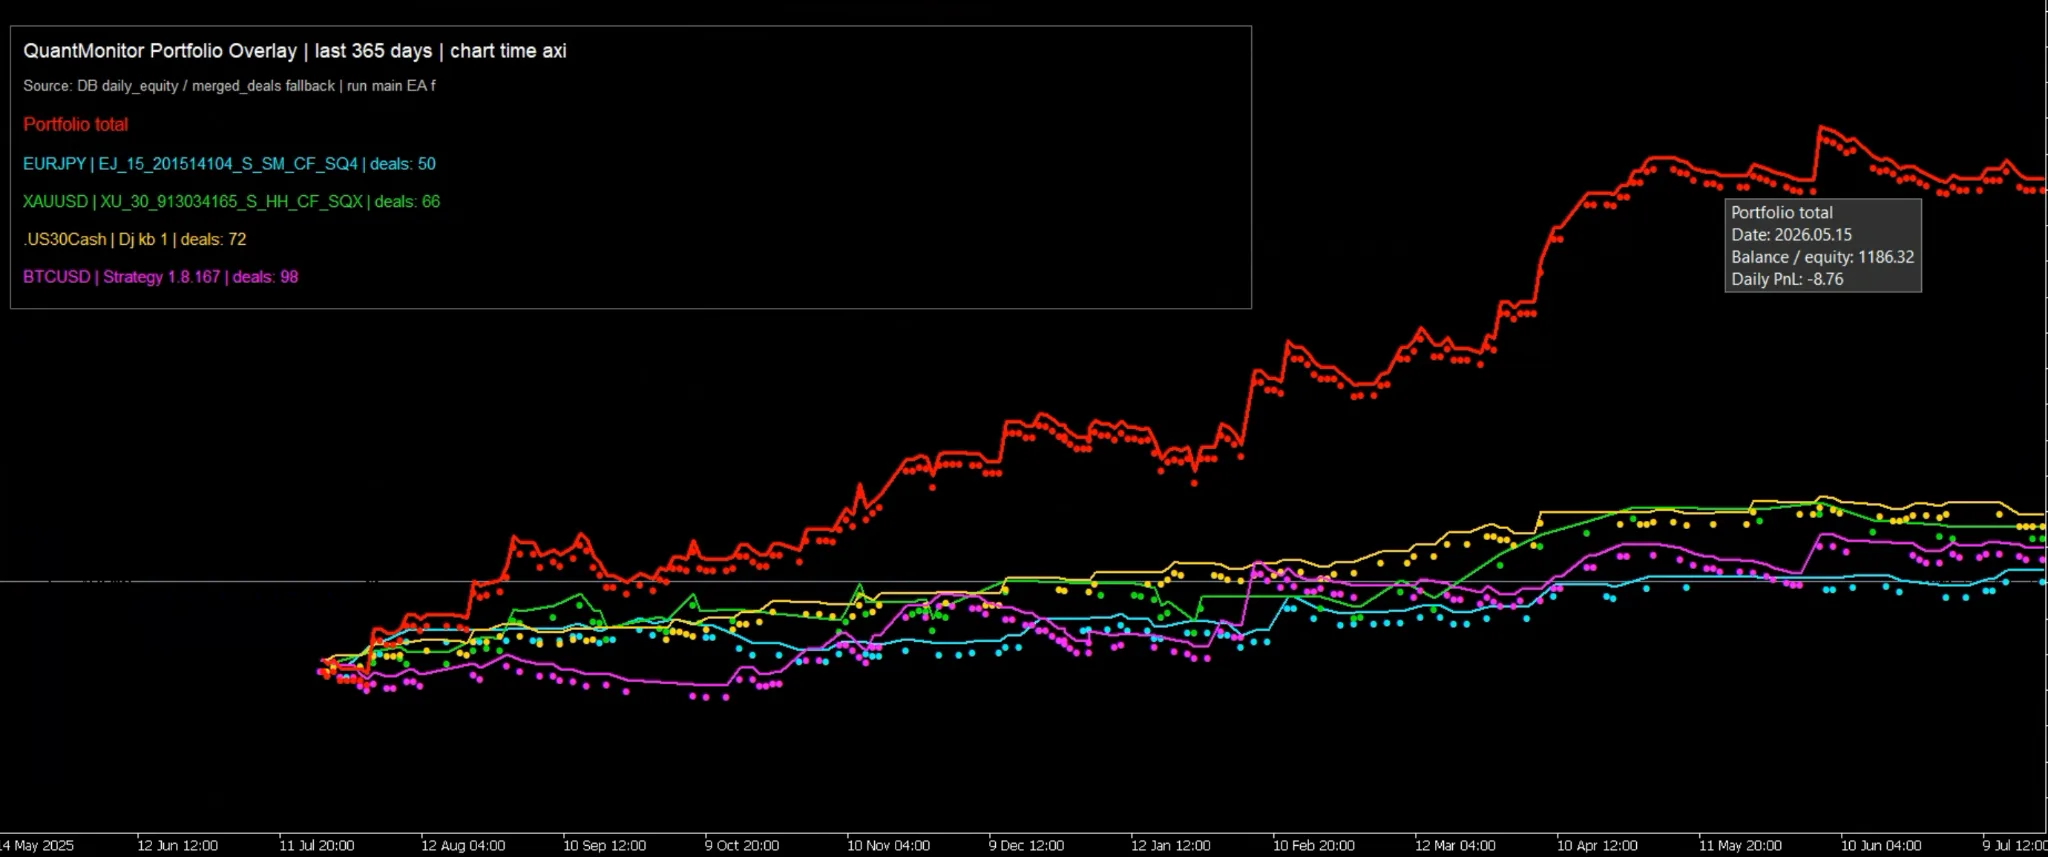
The combined curve is the one that matters. A portfolio can keep progressing while one component stagnates, and it can hide rising concentration if one strategy starts carrying most of the result. That’s why the overlay is paired with rolling correlations, drawdown monitoring and strategy-level equity.
External milestones: funded status and trade-quality recognition
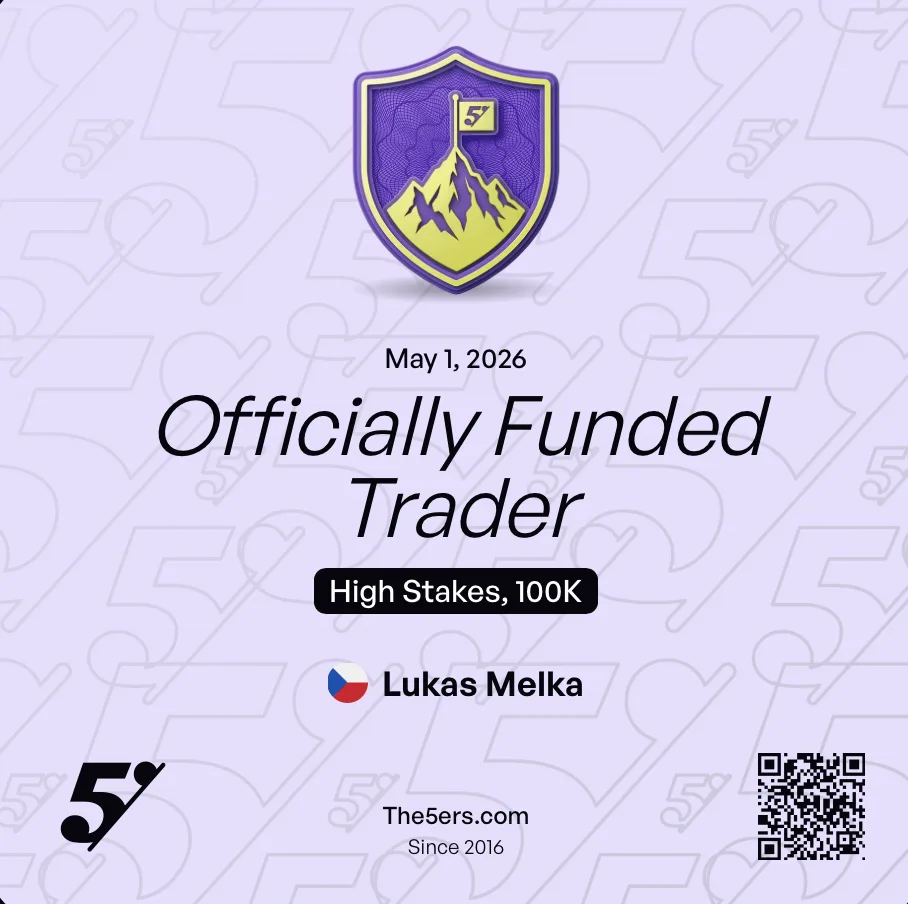
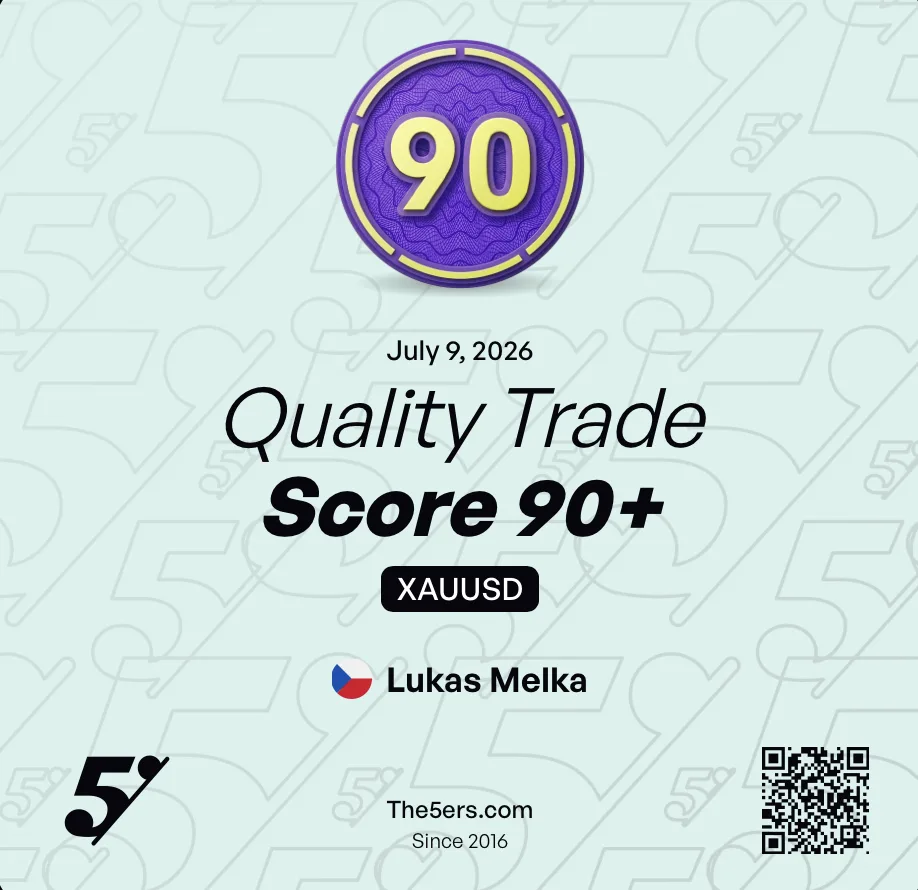
External evaluations don’t replace my own testing, but they add a separate execution constraint. In 2026 I reached two documented milestones with The5ers: funded-trader status in the High Stakes 100K programme, and a Quality Trade Score above 90 for XAUUSD. You can check the record on my public The5ers profile.
Moving from demo observation to a public live account
Recently I launched a live account and made its record publicly accessible through RoboForex Copy Trading. The purpose is accountability: a live record exposes costs, execution differences, position sizing, operational errors and psychological pressure that simply don’t exist in a clean historical test.
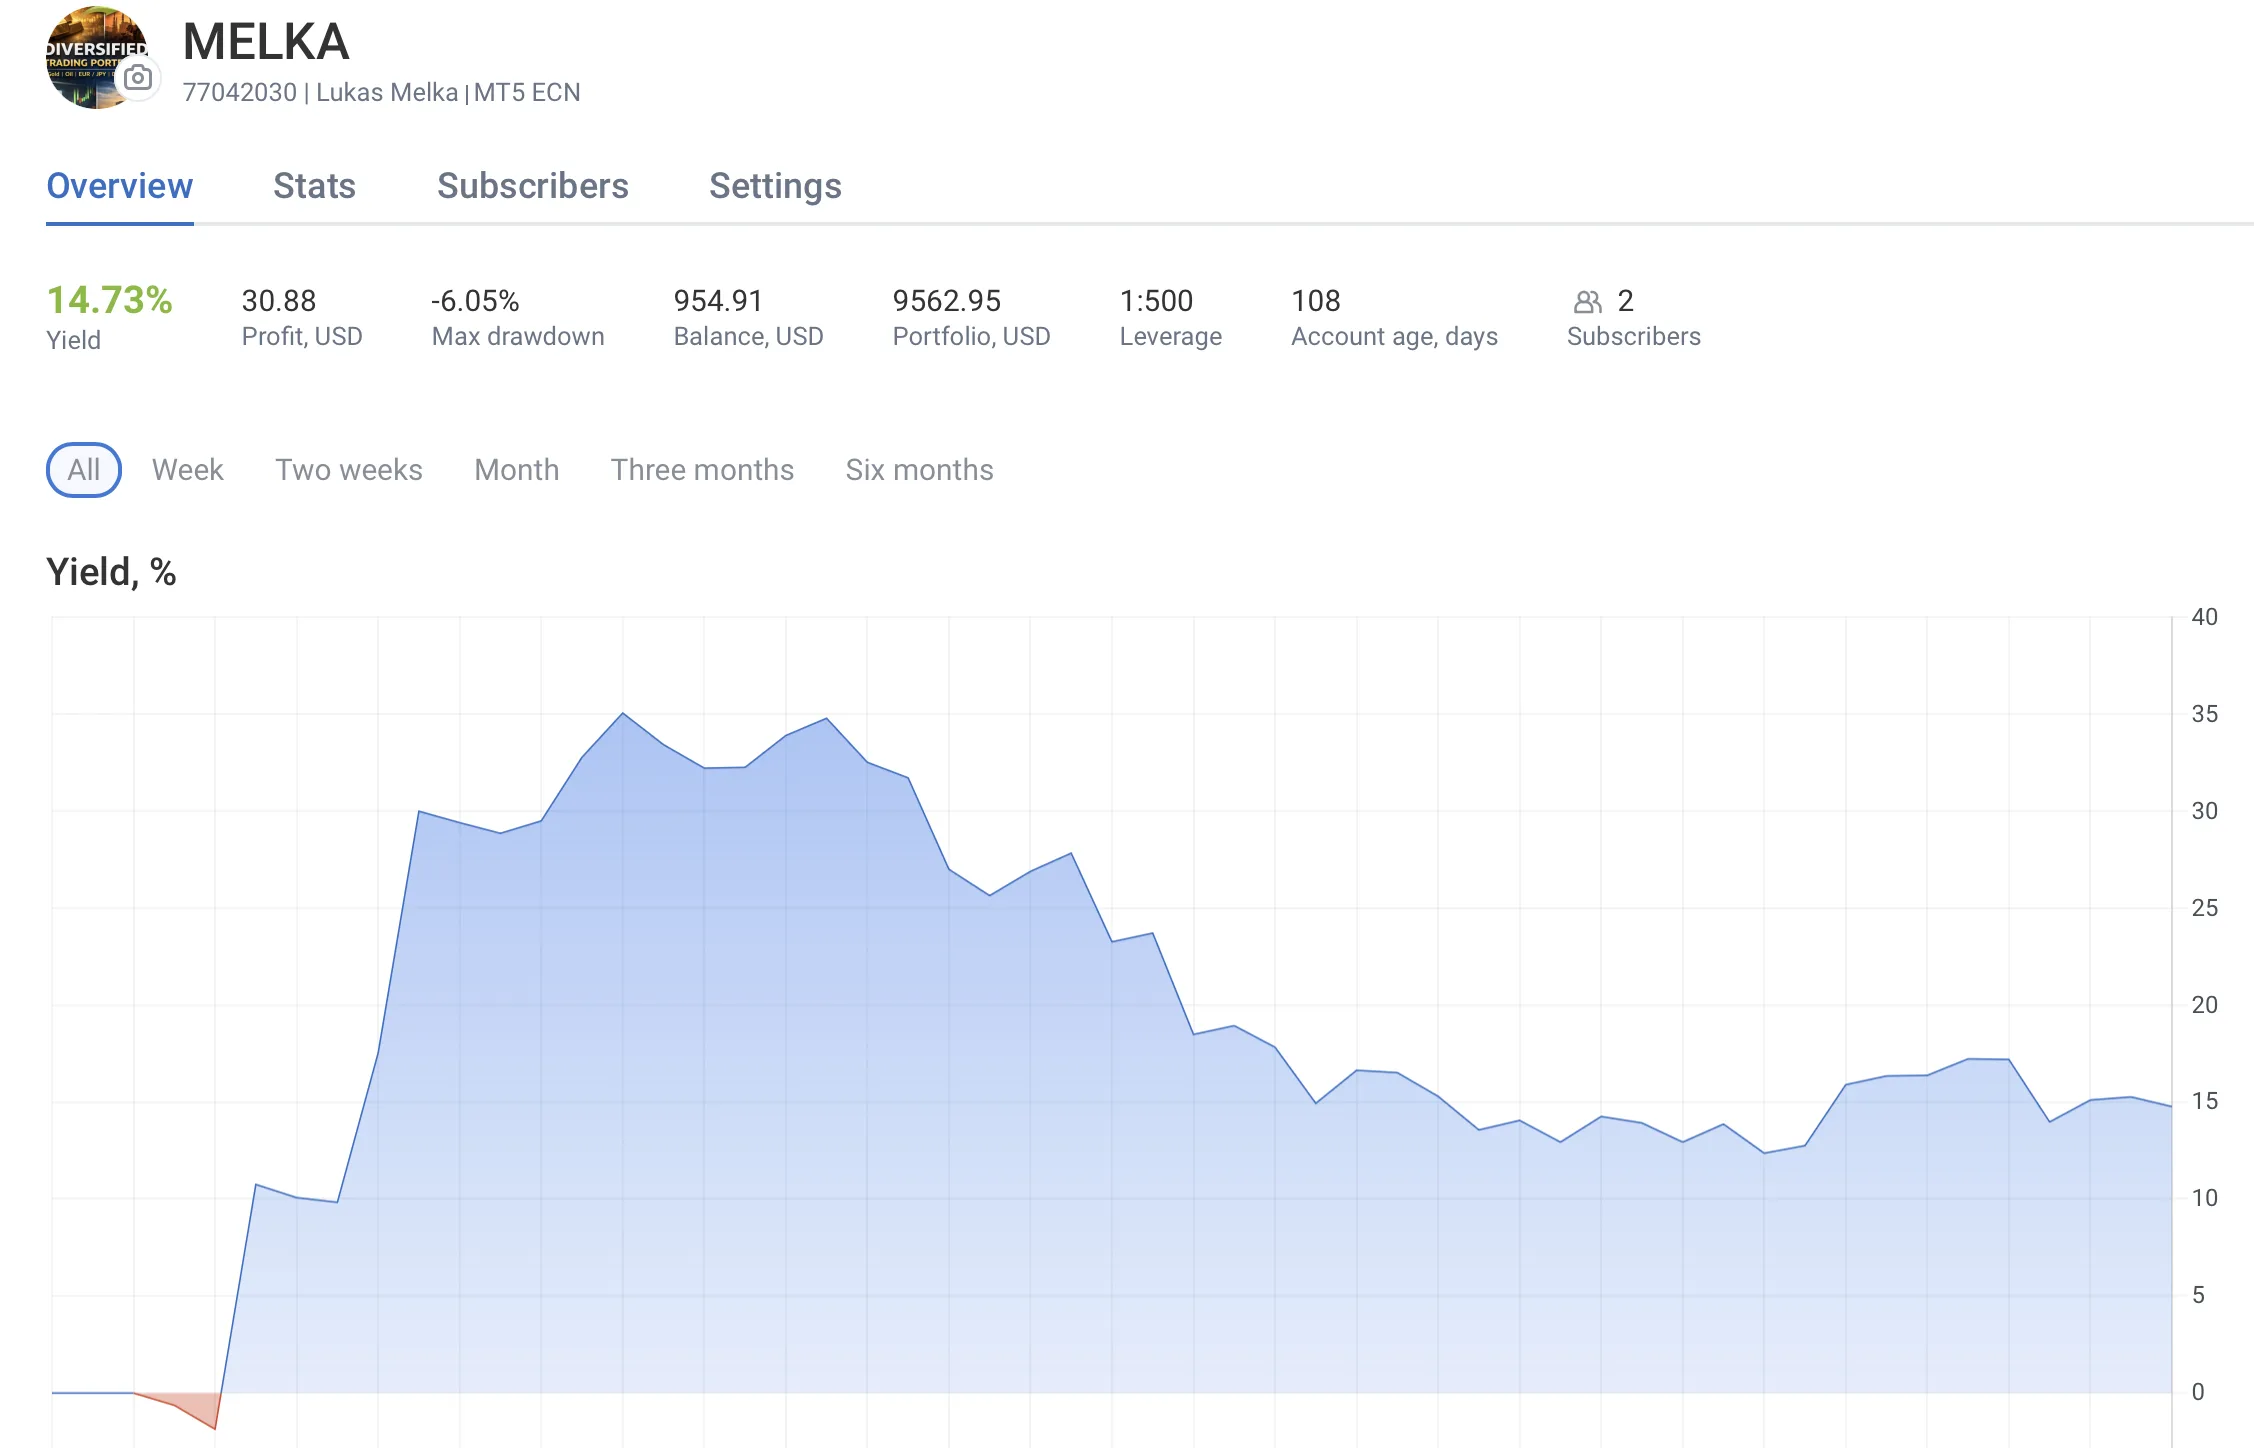
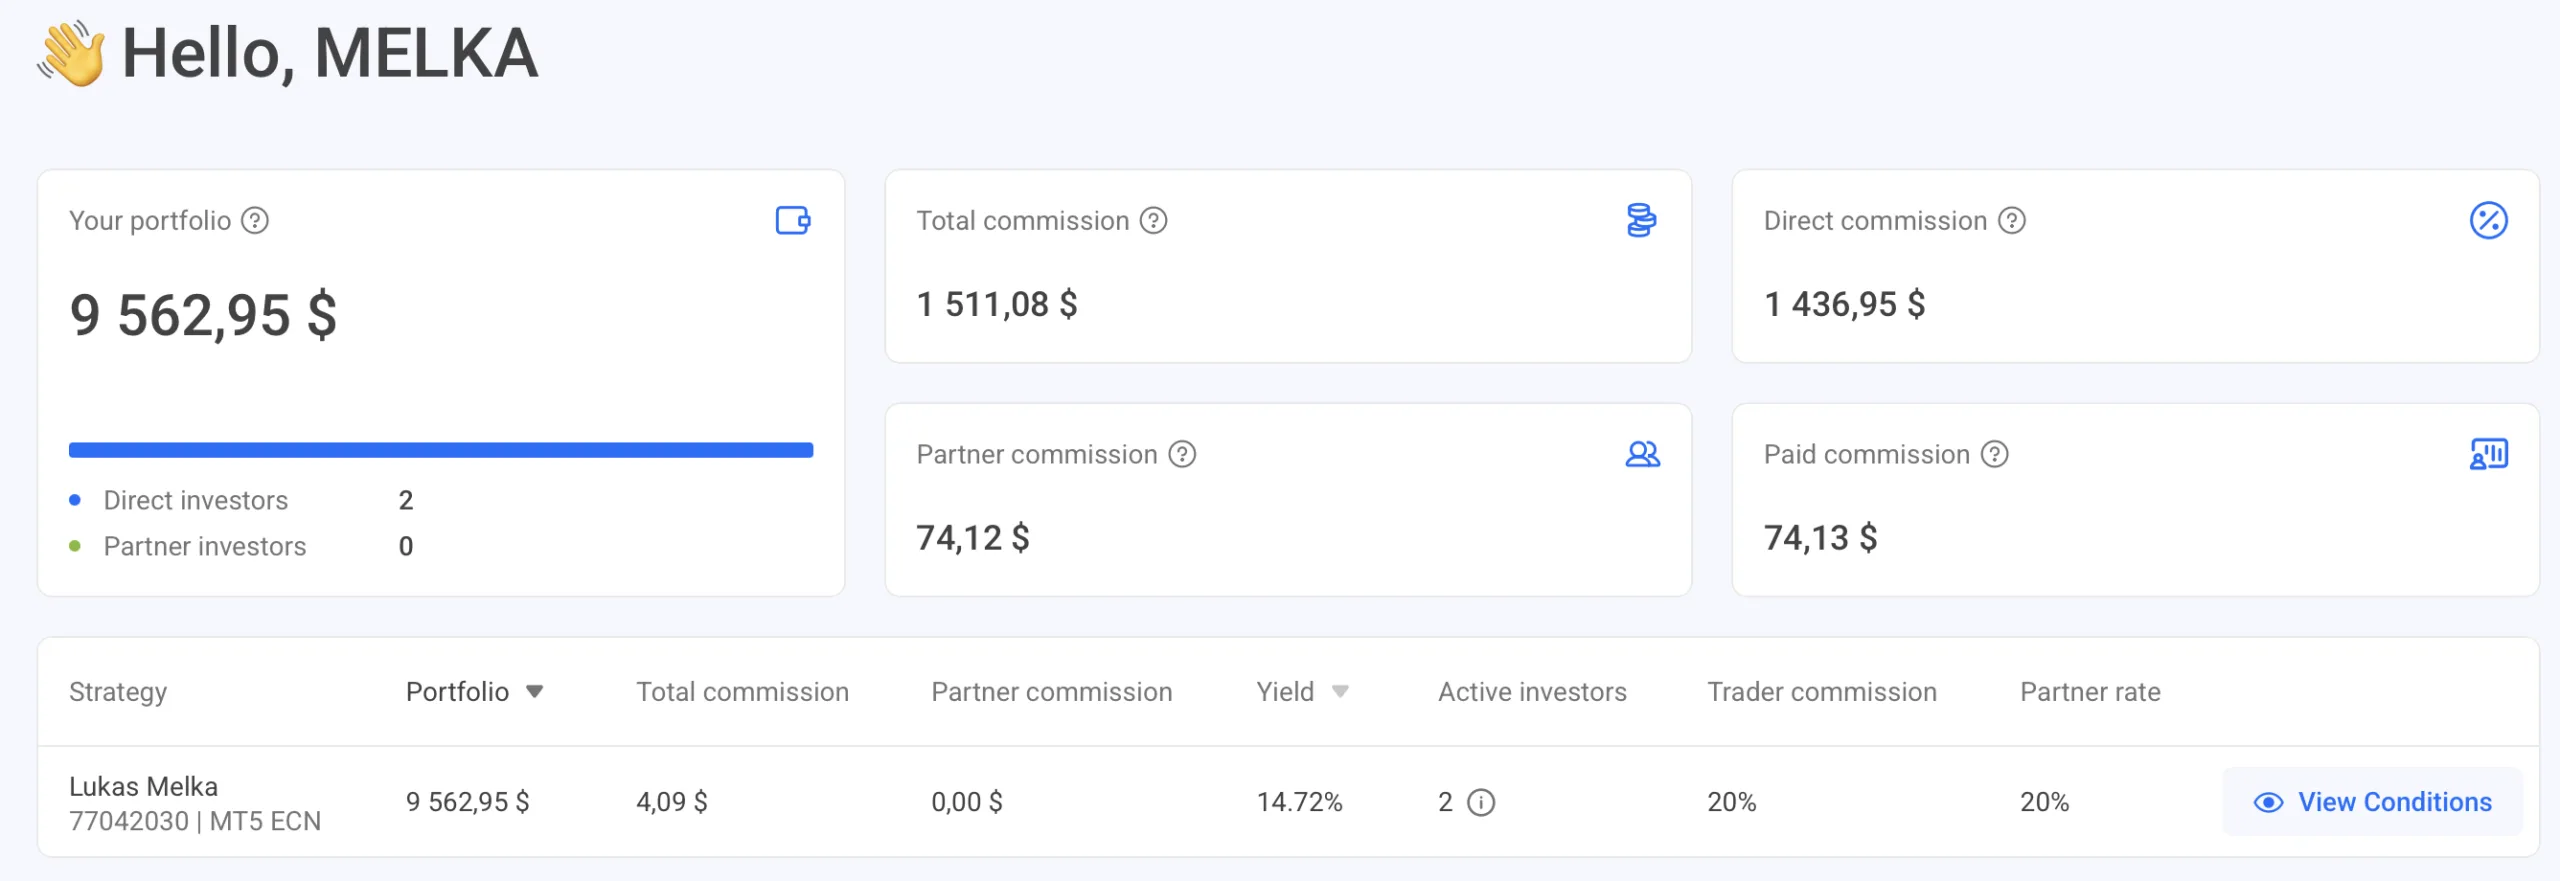
I’ll be blunt about the stage this is at. The 17 July 2026 database report contained only 34 closed live trades across the four tracked strategies, with a combined live P/L of 7.43 units — approximately flat, and far too short for a meaningful verdict. The correct job right now is to verify execution continuity, lot sizes, strategy comments and trade matching. The public RoboForex account is the live source; its figures change after every closed trade, so it takes precedence over any dated screenshot.
What I monitor now
The most important work begins after deployment. I compare the live curve with the model, but I don’t expect them to overlap perfectly — the question is whether the difference is normal noise or evidence that something structural has changed. What I watch:
- Rolling 12-month performance. A negative period isn’t an automatic shutdown; persistent deterioration with a rising drawdown is what matters.
- Drawdown versus historical limits. Both depth and duration — a new high-water drawdown requires investigation, not an emotional reaction.
- Recent profit factor and average trade. A weakening last-100-trade sample can reveal execution damage or a lost edge before the full curve shows it.
- Correlation and loss accumulation. Systems that were historically independent can become temporarily exposed to the same dominant factor.
- Backtest-to-live tracking error. Slippage, commissions, symbol mapping, lot sizing and continuity of strategy identification inside MT5.
- Stagnation. A long flat period can be normal; it gets concerning when several independent quality measures weaken together.
This is the real change in my trading since 2015. I no longer judge progress by one good month or one strong chart. I judge it by the quality of the process: how the system was built, how independent the validation was, how the portfolio behaves under stress, and whether the live record stays close enough to the model to justify continued risk.
Your move: inspect the evidence before the narrative
A trader profile should make the work easier to verify, not harder. So here’s the challenge: don’t take the story — take the record. Open the public RoboForex account and my The5ers profile, study the shape and duration of the drawdowns, check whether the returns come from one market or several independent ones, and compare the live behaviour with the research logic. Treat every screenshot as a dated capture.
Risk and performance disclaimer: this article is for educational and illustrative purposes only and is not investment advice, a recommendation, a solicitation or a promise of future results. Trading Forex, CFDs, futures, indices, metals, energy and cryptocurrencies involves substantial risk and may result in the loss of all capital. Backtests and hypothetical results have inherent limitations and may differ materially from live execution. Normalised portfolio figures are analytical comparisons, not an actual account statement. Past performance is not necessarily indicative of future results. The RoboForex screenshots are dated captures; consult the linked public page for the current record and applicable regional restrictions.